
Figure 4.
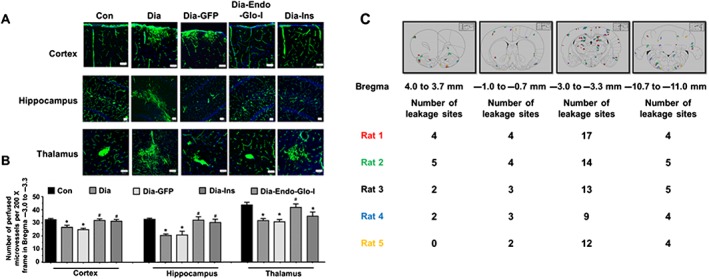
Panel A shows representative images of BSA‐FITC within the confines of microvessels in cortex, hippocampus and thalamus (Bregma −3.0 to −3.3) used as an index of the density of microvessel perfusion in Con, Dia, Dia GFP, Dia‐Endo‐Glo‐I and Dia‐Ins rats. White bar at bottom of each image = 50 μm. Panel B shows summary data from 5 animals per group as means ± SEM. * P < 0.05, significantly different from Con; # P < 0.05, significantly different from Dia. Panel C shows sites of BSA‐FITC leakage in the various brain regions (upper panel) obtained from 5 separate animals. Data from each rat is colour‐coded for easy visualization. Table below shows the number of leakage sites within each region of the brain.