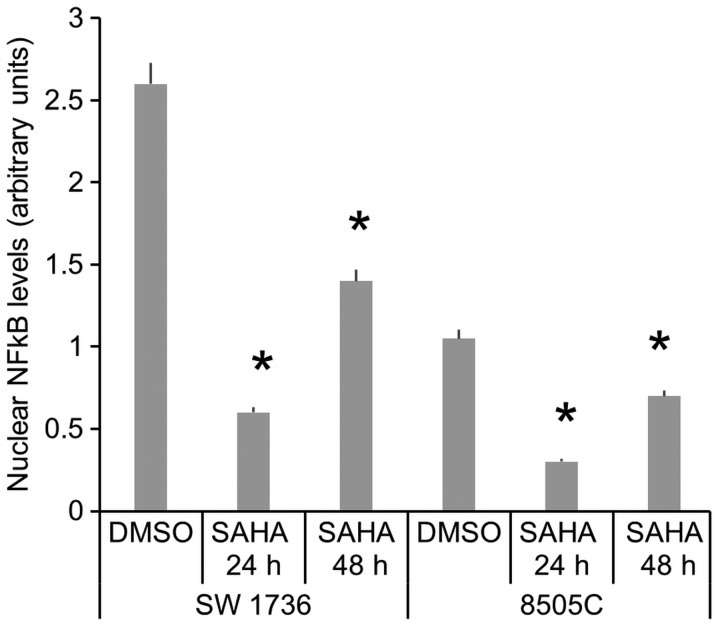
Figure 4.
Effects of SAHA treatment on activated NF-κB levels in ATC cell lines. Densitometric analysis of nuclear NF-κB protein levels in SW1736 and 8505C cell lines after DMSO or SAHA 3 µM administration for 24 or 48 h. For each cell line, the results were normalized against LSD1 expression and expressed in arbitrary unit. Results are shown as mean ± standard deviation. *P<0.05 by Student's t-test.

