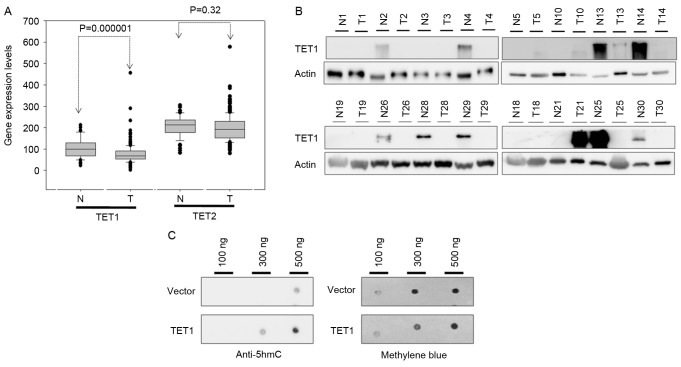
Figure 2.
Expression levels of TET1 and TET2 in gastric cancer. (A) Expression levels of TET1 and TET2 were analyzed in 311 gastric cancer and 57 adjacent normal tissues from the Gene Expression Across Normal and Tumor Tissue database. (B) Expression levels of TET1 protein were decreased in gastric cancer tissues obtained from 16 patients with gastric cancer compared with the normal adjacent tissues. (C) TET1 overexpression increased the global 5hmC expression levels in the genomic DNA of AGS cells. The loading control was visualized using methylene blue staining. N, normal; T, tumor; TET, ten-eleven translocation; 5mC, 5-methylcytosine; 5hmC, 5-hydroxymethylcytosine.

