Fig. 6.

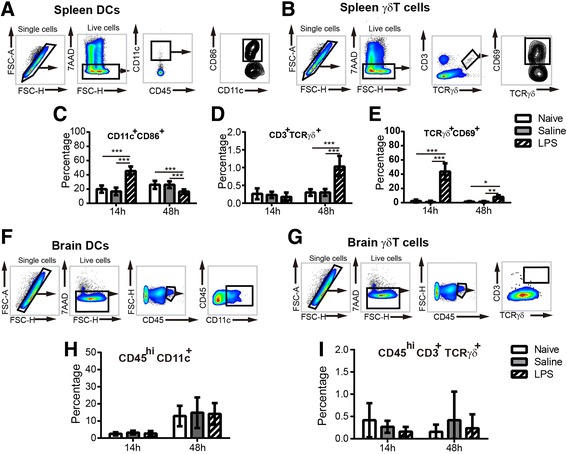
The presence and activation of dendritic cells and γδT lymphocytes in the spleen and brain after LPS-induced sepsis. a The gating strategies for analyzing CD11c+ dendritic cells and CD86 expression in the spleen. b The gating strategies for analyzing γδT lymphocytes and CD69 expression in the spleen. The percentage of CD11c+CD86+ cells (c) in the spleen at 14 and 48 h after LPS injection. The percentage of CD3+TCRγδ+ cells (d) and CD3+TCRγδ+CD69+ cells (e) in the spleen at 14 and 48 h after LPS injection. At 14 h: naive = 6 mice, saline = 6 mice, LPS = 6 mice; at 48 h: naive = 5 mice, saline = 7 mice, LPS = 9 mice. f The gating strategies for analyzing the dendritic cells in the brain. g The percentage of CD45hiCD11c+ cell populations in the brain at 14 and 48 h after LPS injection. h The gating strategies for analyzing the γδT lymphocytes in the brain. i The percentage of CD45hiCD3+TCRγδ+ cells in the brain at 14 and 48 h after LPS injection. At 14 h: naive = 6 mice, saline = 3 mice, LPS = 9 mice; at 48 h: naive = 5 mice, saline = 5 mice, LPS = 6 mice. All data are presented as means ± SD. *p < 0.05, **p < 0.01, ***p < 0.001, by two-way ANOVA with LSD for pairwise comparisons
