
FIG 3.
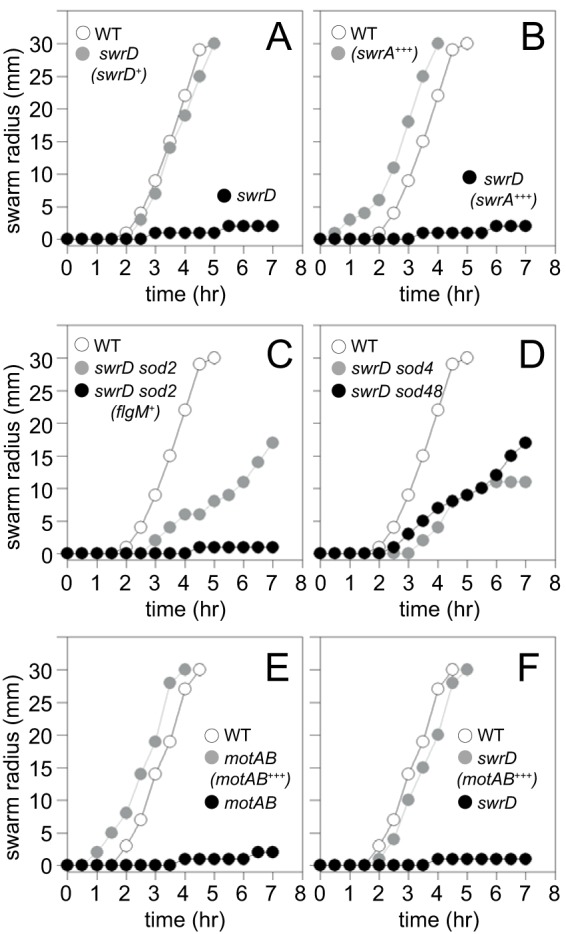
Cells mutated for swrD do not swarm, and swarming can be rescued by increasing the expression of motAB. (A to F) Quantitative swarm expansion assays. The relevant genotype of each strain is indicated within the graph. Gene names in parentheses indicate genes introduced at an ectopic locus. + indicates that genes are expressed from their native promoter. +++ indicates that the genes indicated have been overexpressed by the addition of 1 mM IPTG. Wild type (WT) data were reproduced in panels A to D and separately in panels E and F to match the experimental strains in the corresponding data set. Each data point is the average result of three replicates. The following strains were used to generate the data: in panel A, 3610 (WT), DS6657 (swrD), and DS7550 [swrD (swrD+)]; in panel B, 3610 (WT), DK1597 [swrD (swrA+++)], and DS860 (swrA); in panel C, 3610 (WT), DS6698 (swrD sod2), and DK1839 [swrD sod2 (flgM+)]; in panel D, 3610 (WT), DS7527 (swrD sod4), and DK48 (swrD sod48); in panel E, 3610 (WT), DS222 (motAB), and DK801 [motAB (motAB+++)]; in panel F, 3610 (WT), DS6657 (swrD), and DK4651 [swrD (motAB+++)].