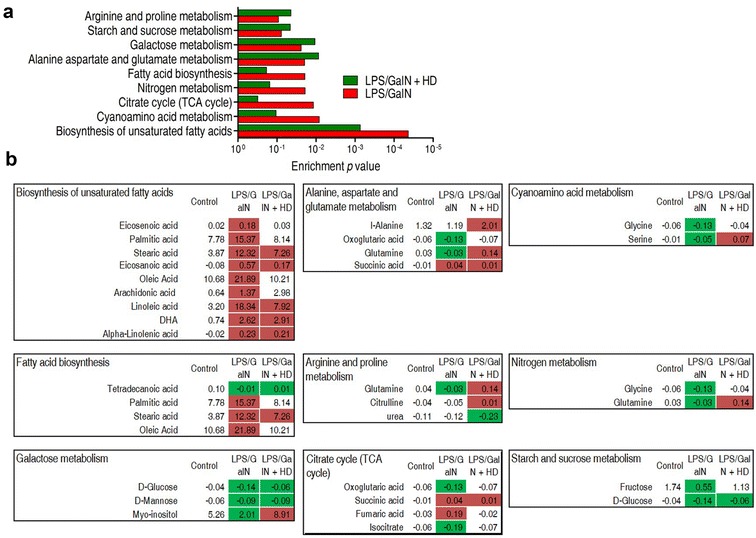
Fig. 4.

Pathway analysis and integrative analysis. a Pathway enrichment analysis of differential metabolites form LPS/GALN and LPS/GALN + HD using an online tool, Metaboanalyst 3.0 (http://www.metaboanalyst.ca/). Significantly enriched pathways are selected to plot. b Integrative analysis of metabolites in significantly enriched pathways. Up-regulation and down-regulation of metabolites are indicated as red and green, respectively. The number reveals the ratio of differential metabolites
