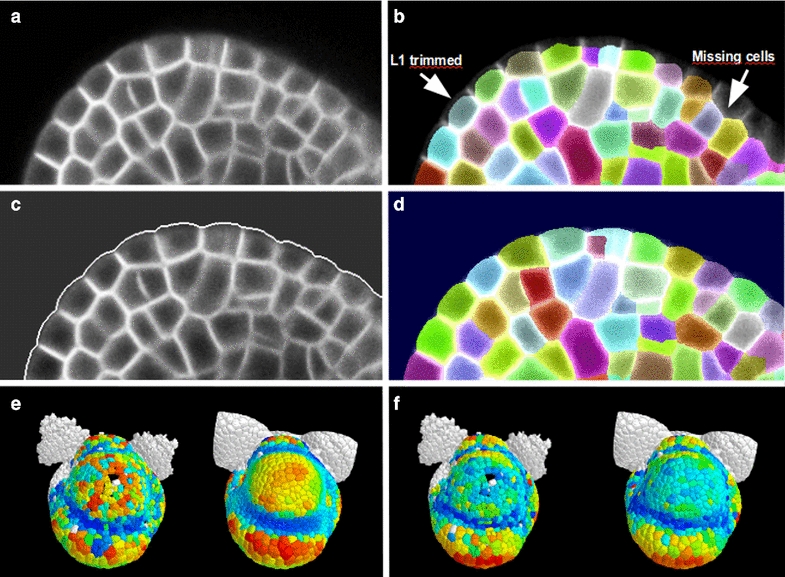
Fig. 3.

Cellular segmentation of a modified image with reinforced tissue contour. a Section of original 3D image to segment, where the outer periclinal walls are poorly marked. b The result of watershed segmentation (using MARS pipeline): the outer cell layer is trimmed and there may be even some missing cells. c Using the outer contour detected by the level set method, the outer periclinal walls are enhanced on the image, and the outer background is put to the most frequent value of the inner tissue. d The result of the watershed segmentation of the modified image. e Gaussian curvature and f cell volume is computed and represented first on data obtained by watershed segmentation of the original image, and second on data obtained with the improved MARS pipeline where the outer periclinal walls were enhanced using the contour level set before doing watershed
