
Fig. 6.
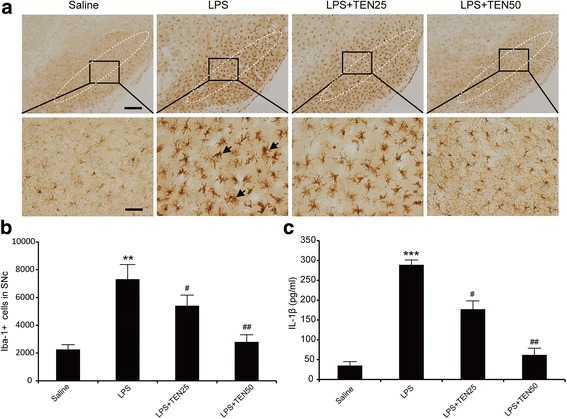
Tenuigenin attenuates microglia activation induced by LPS in SNc and suppress LPS-induced serum IL-1β production. a Immunostaining with Iba-1 to visualize the activation of microglia in the SNc of each group. Scale bar represents 200 μm (upper) or 50 μm (under). b Stereological counts of Iba-1-positive cells in the SNc of each group. c ELISA of IL-1β in serum of each group. n = 6 for each group. Data are expressed as mean ± SEM, one-way ANOVA, **p < 0.01 and ***p < 0.001 vs. saline group. # p < 0.05 and ## p < 0.01 vs. LPS group