Fig. 3.

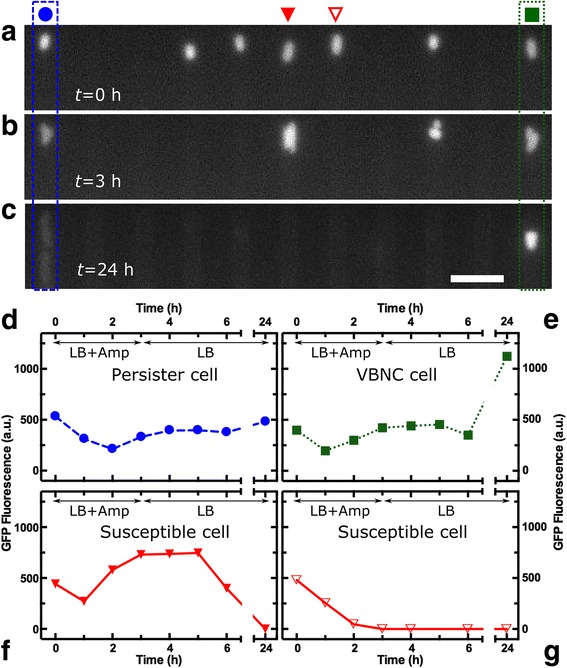
GFP fluorescence patterns in single viable but non-culturable (VBNC) cells. Fluorescence images reporting GFP expression levels, as a proxy for the activity of the promoter of tolC, in a single VBNC cell (green square), alongside a persister cell (blue circle) and five susceptible cells (a) before, (b) during, and (c) after drug treatment. Scale bar, 5 μm. Corresponding fluorescence patterns for the (d) persister, (e) VBNC, and (f, g) the two selected susceptible cells in the images above. The VBNC cell exhibited a fluorescence pattern similar to the one of the persister cell throughout the entire assay, but the VBNC cell was much brighter and easily distinguishable at t = 24 h. This suggests that the fluorescence associated to the tolC reporter strain could be used to isolate VBNC cells from the remainder of the population after ampicillin treatment and 21 h exposure to LB. The two susceptible cells displayed very different responses to the antibiotic treatment. For the cell in (f) (marked with a filled triangle in Fig. 3a), fluorescence levels increased during and immediately after drug treatment but decreased after t = 5 h, with the cell eventually lysing by t = 24 h. For the cell in (g) (marked with an open triangle in Fig. 3a), fluorescence levels decreased during drug treatment, with the cell lysing by t = 3 h. This suggests that besides the four phenotypes introduced in Figs. 1 and 2, there are at least two further subgroups of susceptible cells (Additional file 3: Figure S3)
