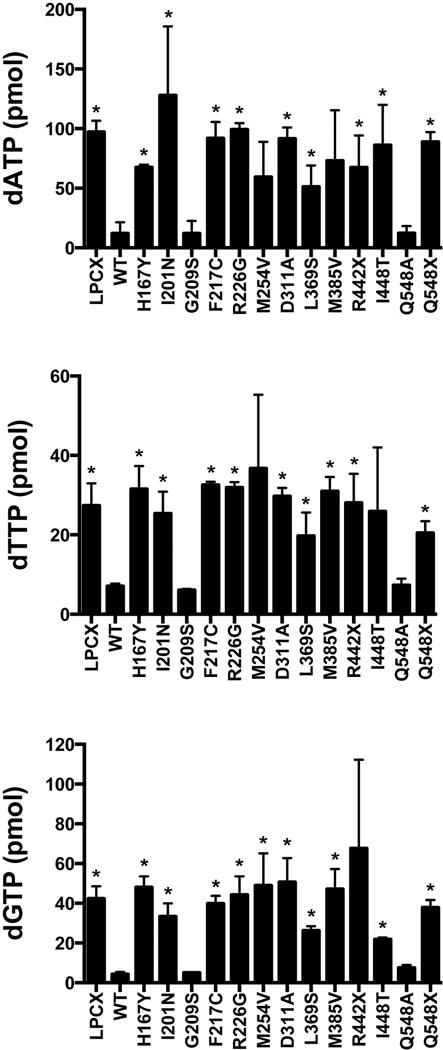
Figure 6. Cellular dATP, dTTP and dGTP levels in U937 cells stably expressing the different SAMHD1 variants.

Quantification of dATP, dTTP and dGTP levels on PMA-treated U937 cells expressing the indicated SAMHD1 variants was performed by a primer extension assay as previously described. Similar results were obtained in three independent experiments and standard deviation is shown. “ * “ Indicates statistical significance compared to U937 cells expressing WT SAMHD1 as determined by an unpaired student t-test with P > 0.05. WT, wild type.
