
Fig. 2.
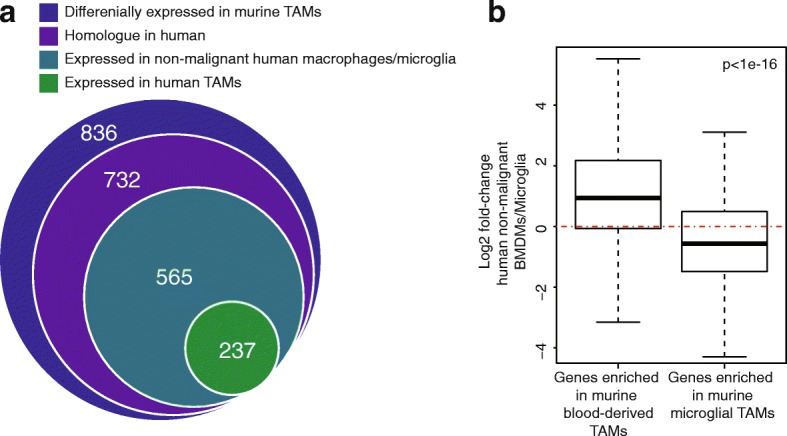
Analysis of published data identifies markers of ontogeny. a The intersection of: (1) genes that are differentially expressed between blood-derived and microglial TAMs in mouse (outer circle); (2) their homologues; (3) genes expressed (mean CPM > 1) in human BMDM/microglia from non-malignant tissue; and (4) TAMs from human gliomas (n = 16 patients). b Distributions of the log2 ratios (human BMDMs over microglia) (y-axis) for the differentially expressed murine-TAM homologues from (a)