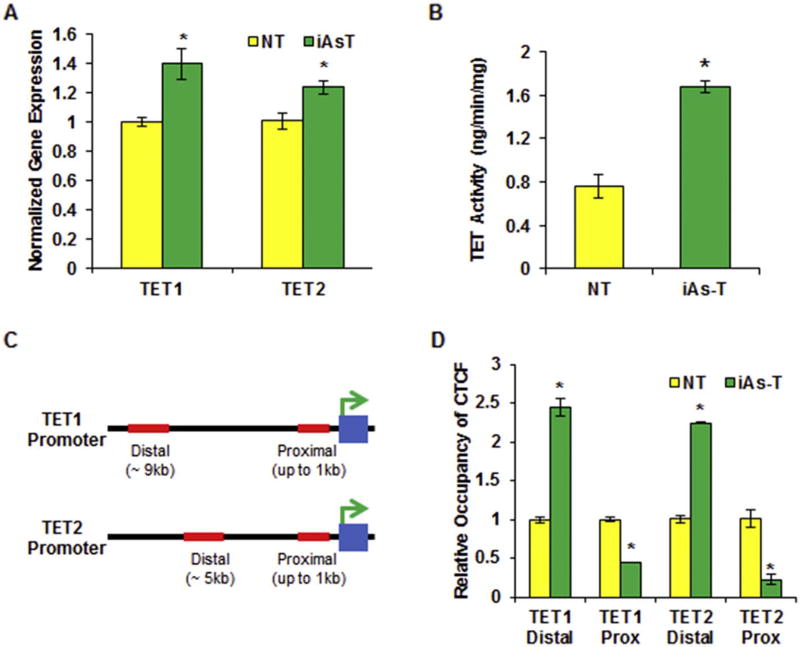
Fig. 6.
CTCF binding is preferentially increased at the distal binding site of the TET promoter in iAs-T cells directing increased expression. (A) Graphic representation of qRT-PCR results showing an increase in gene expression for TET1 and TET2 in iAs-T cells. (B) Graphic representation of increase in TET hydroxylase activity in iAs-T cells compared o NT cells. Shown here is Specific Activity as measured using hydroxylated product produced (ng/min/mg). Experiments were done in triplicates (C) Cartoon showing the distal and proximal CTCF binding sites of TET1 (top) and TET2 (bottom) promoters (D) Graphic representation of ChIP-qRT-PCR results for CTCF occupancy at TET promoters reveals increased relative occupancy binding at distal promoter sites and decreased binding at the proximal CTCF binding sites. The * denotes p < 0.05, error bars represent the SEM.

