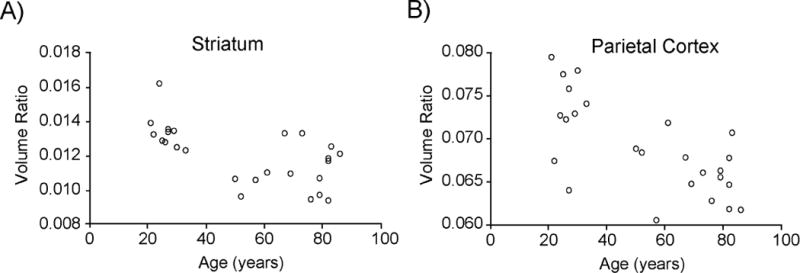
Figure 1. Scatter plots of regional volume relative to total intracranial volume (volume ratio) plotted against age.

Spearman’s rank-order correlation analyses revealed negative correlation between regional volume ratio (unitless) and age in six (striatum, temporal cortex, occipital cortex, cingulate cortex, frontal cortex, and parietal cortex) of the nine regions of interest. Individual data points are shown for two representative regions including A) Striatum (rho = −0.605, P = 0.001) and B) Parietal Cortex (rho = −0.627, P = 0.001). Significance was set at P < 0.0056 using Bonferroni correction for the nine regions tested.
