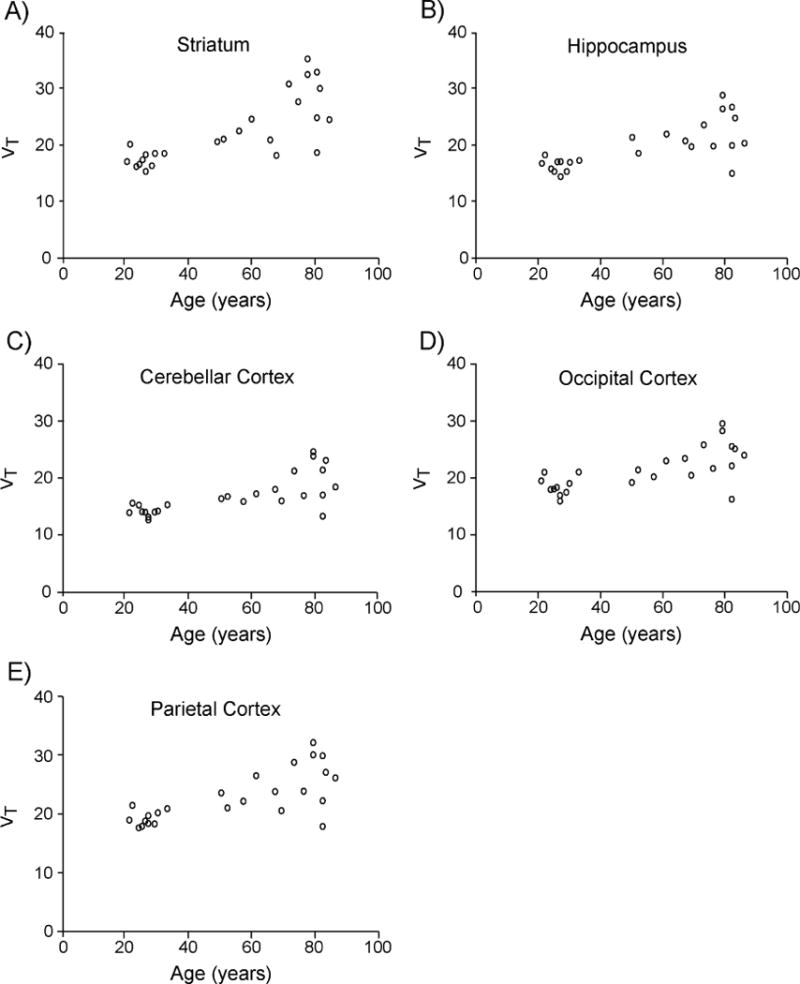
Figure 2. Scatter plots of regional [18F]ASEM total distribution volume values (VT) plotted against age.

Regional VT was estimated using metabolite-corrected arterial input function and Logan analysis (t* = 45 minutes) from 90 minute [18F]ASEM data. Individual data points are shown for five representative regions including A) Striatum, B) Hippocampus, C) Cerebellar Cortex, D) Occipital Cortex and E) Parietal Cortex that were selected from the nine regions studied. Using Spearman’s rank-order correlation analysis, all regions of interest in this study showed positive correlation between age and regional [18F]ASEM VT (P < 0.0056, which marks significance after applying Bonferroni correction for the nine regions tested). VT is in units of mL cm−3.
