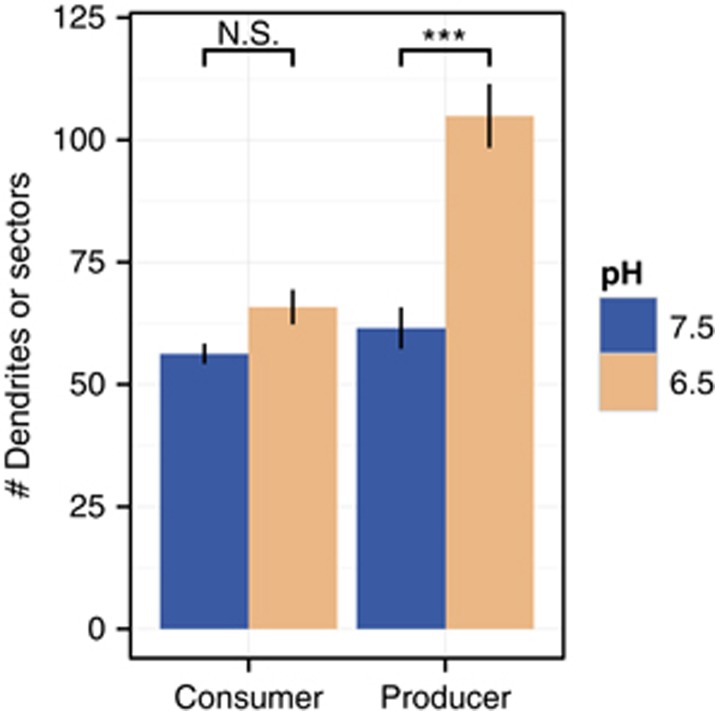
Figure 3.
Mean numbers of sectors or dendrites. Consumer dendrites and producer sectors were measured radially at the position of the consumer front. The consumers and producers were measured on the same plates. N=13, error bars=standard error of the mean (s.e.m.), ***P of the Mann–Whitney test below 0.01.

