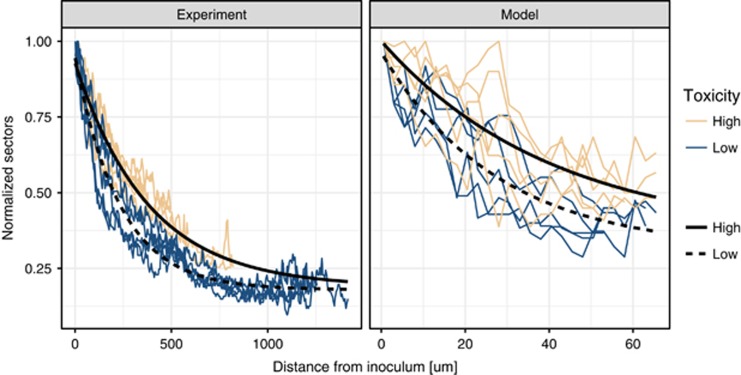
Figure 4.
Decrease of sector numbers with distance from inoculum (in pixels). (Left) Experimental data. (Right) Simulated data. Strong nitrite toxicity slows the loss of sector numbers during expansion, resulting in higher local diversity. Nitrite toxicity in the experimental data is manipulated via pH (7.5 for weak toxicity and 6.5 for strong toxicity), while in the model it represents the strength of the inhibition term (Supplementary Information). Note that here we normalized the sector numbers to the initial number of sectors in order to facilitate comparison between the experimental and modeled data.

