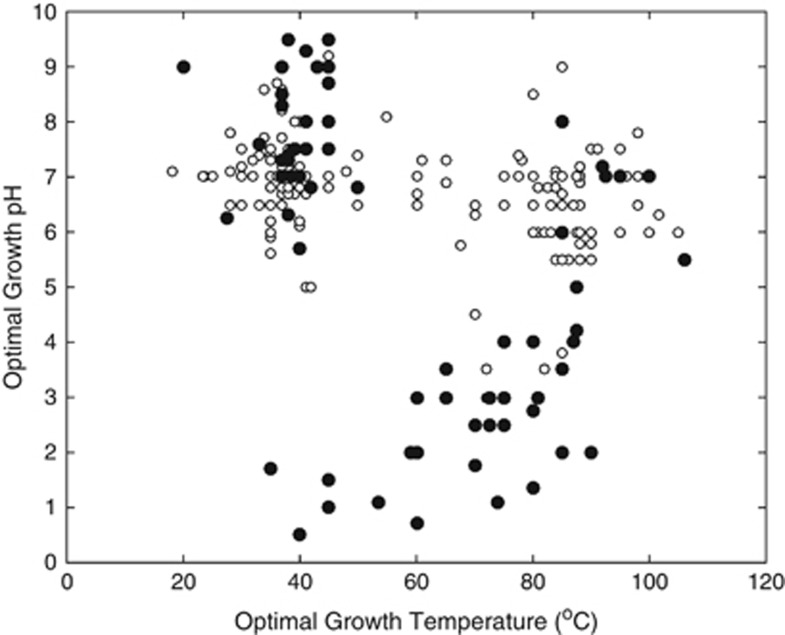
Figure 3.
Optimal growth pH, optimal incubation temperature and O2 usage for archaeal cultivars. Each point represents a single archaeal cultivar (N=255) that is colored based on the ability (aerobe; black circles; n=76) or inability (anaerobe; white circles; n=179) to incorporate O2 into their metabolism.

