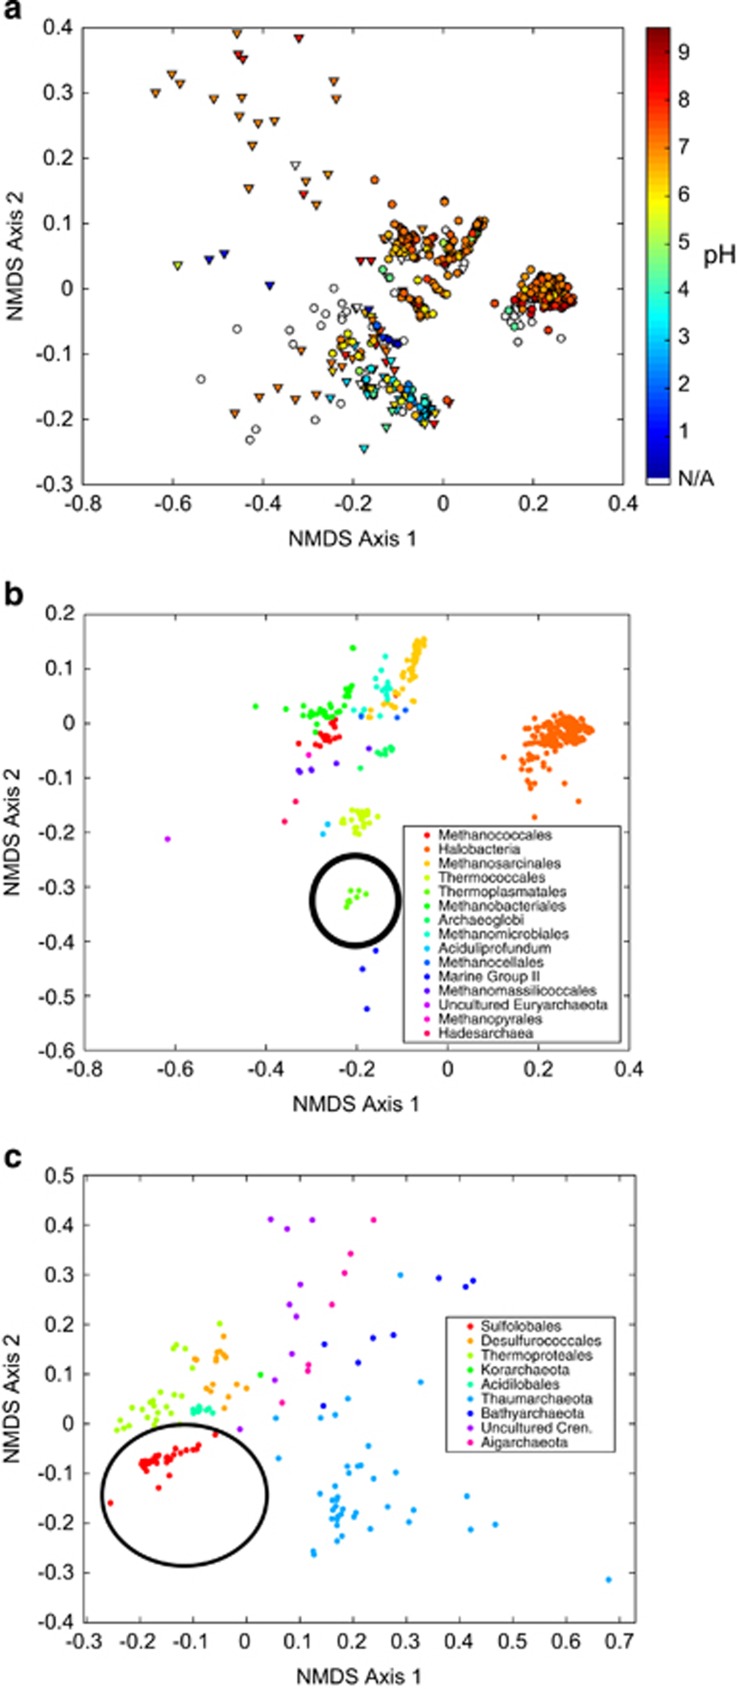
Figure 4.
Similarity in protein-coding genes among archaeal genomes. (a) Nonmetric multidimensional scaling (NMDS) plot of protein-coding gene bins among all archaeal genomes. Symbols are as in Figure 2: cultivar genomes are shown as circles and reconstructed genomes from environmental samples are shown as triangles. Symbol color refers to pH optima or environmental pH according to the scale on the right. (b) NMDS plots including only Euryarchaeota genomes and (c) TACK superphylum genomes. Thermoplasmatales and Sulfolobales are indicated with black circles in b, c, respectively. Each point represents a genome, and points are colored according to taxonomic orders as given by the legends on the right. Axes represent relative positioning of genomes to one another, such that points closer together are more similar, and points farther apart are less similar.

