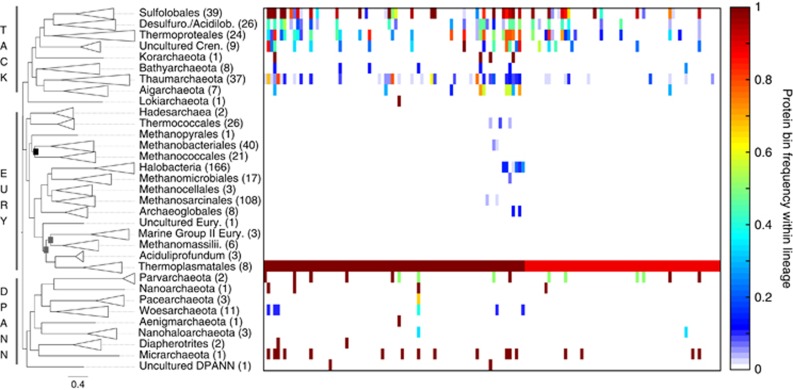
Figure 5.
Heatmap showing the distribution of Thermoplasmatales-enriched protein-coding genes among non-Euryarchaeota genomes. The Maximum Likelihood tree is the same as shown in Figure 2. Protein bin distribution is only shown for those protein-coding genes with >87% frequency within the Thermoplasmatales lineage (n=138), and which most differentiate the Thermoplasmatales from other Euryarchaeaota based on ‘indicator’ values. Annotations for each protein bin are given in Supplementary Table S7.

