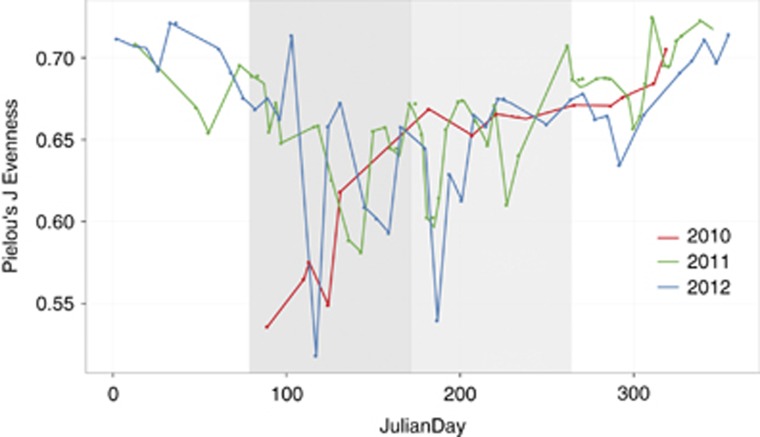
Figure 1.
Spring and summer harbor communities of skewed evenness. Pielou’s J metric of evenness is represented on the y axis and Julian days on the x axis. A value of 1.0 represents total community evenness. Spring and summer are denoted by the dark and light gray areas, respectively. Line colors denote year: red=2010, blue=2011, green=2012.

