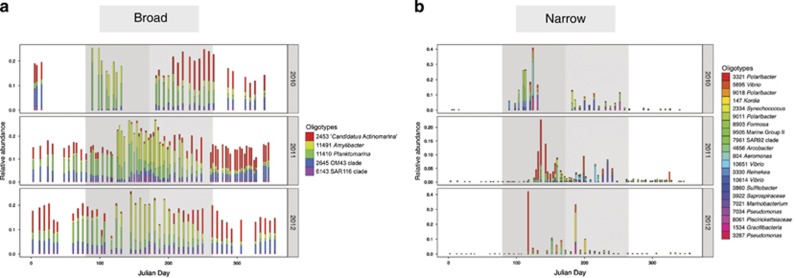
Figure 2.
Oligotypes show distinct patterns of prevalence each year. Relative abundance plots show 'broad' (a) and 'narrow' (b) categories of oligotype prevalence patterns. Julian days are represented on the x axis and oligotype relative abundance is represented as a fraction on the y axis. Spring and summer are denoted by the dark and light gray areas, respectively. Broad oligotypes are defined by >75% prevalence and narrow oligotypes are defined by <10% prevalence. All five broad oligotypes identified in Figure S6 are shown in panel A and collectively occupy ~20% of the total community throughout the year. Narrow oligotypes reaching an abundance of 5% in at least one sample are shown in panel B and are enriched in spring and summer. Julian days with no bar indicate the absence of a sample point. Table S6 contains a full list of identified broad and narrow oligotypes.

