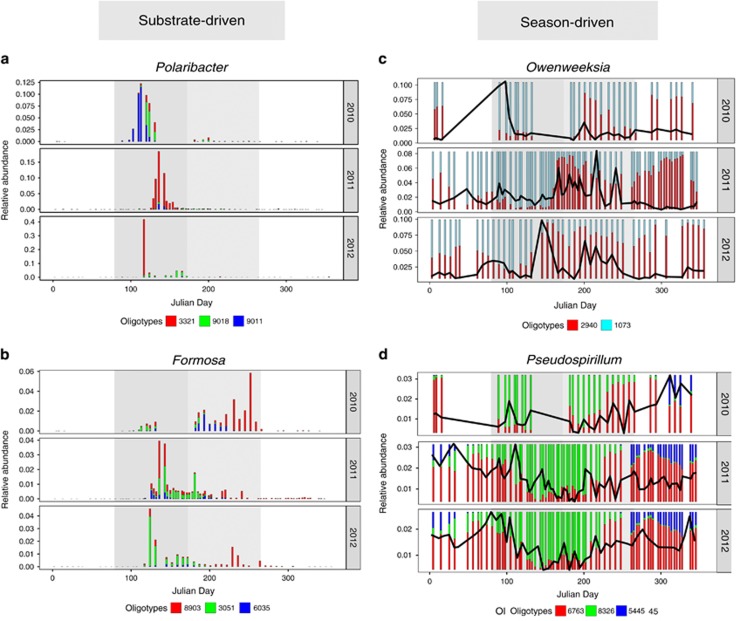
Figure 3.
Season and phytoplankton substrate-driven oligotype switching is observed between oligotypes with >97% identity. Relative abundance bar plots show examples of switches in oligotype dominance. Julian days are represented on the x axis and total oligotype relative abundance is represented as a fraction on the y axis. Spring and summer are denoted by the dark and light gray areas, respectively. Flavobacteriia genera Polaribacter (a) and Formosa (b) exhibit potential phytoplankton substrate-driven changes in dominance over short time intervals between oligotypes with 99.5% identity. Genera Owenweeksia, (c, Flavobacteriia) and Pseudospirillum (d, Gammaproteobacteria) exhibit sinusoidal seasonal changes in dominance between oligotypes with >97% identity, visible when relative abundance is scaled to 1 (stacked bars). The total cumulative relative abundance of displayed oligotypes in c and d is represented by the black line (y axis).

