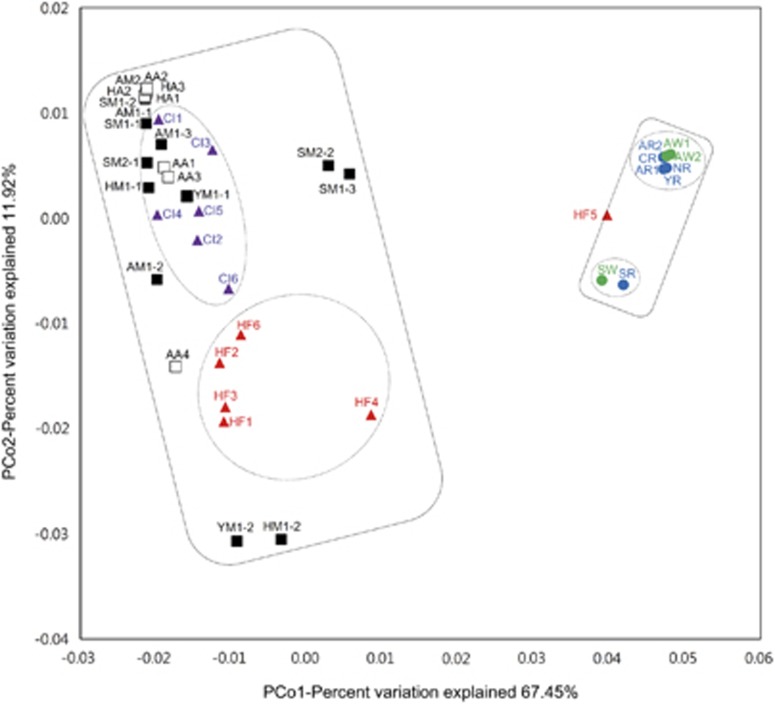
Figure 1.
Principal coordinates analysis of weighted UniFrac distances based on 460 AAC(6′)-Ib protein sequences in various environmental samples. All samples are displayed as follows: river (blue circle), wastewater treatment plants (green circle), mountain soil (black square), agricultural soil (white square), chicken intestine (purple triangle) and human feces (red triangle). The main and sub-categories with statistically significant differences (Supplementary Table 5) are indicated by solid and dashed lines, respectively.

