
Figure 3.
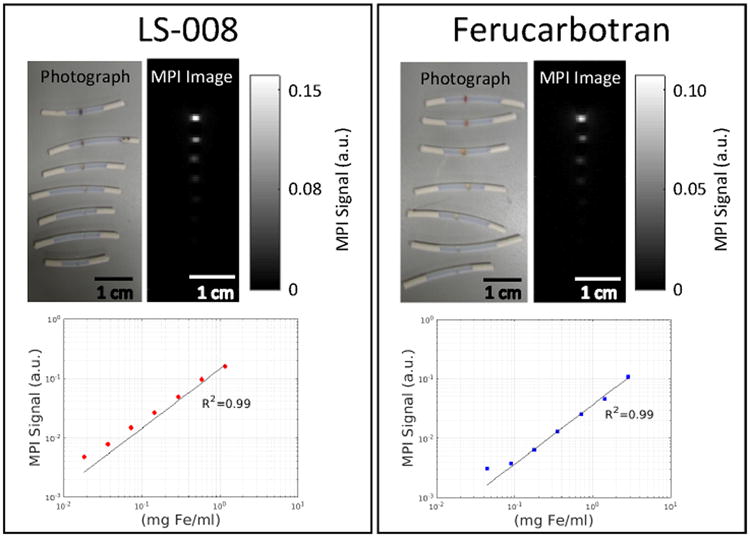
A series of dilutions were performed to demonstrate the linearity of MPI signal with particle concentration. On the left is a photograph of LS-008 point sources and the corresponding maximum projection intensity MPI image as well as the plot of MPI signal versus Fe concentration. On the right is a photograph of Ferucarbotran point sources and the corresponding maximum projection intensity MPI image as well as the plot of MPI signal versus Fe concentration. In both cases the MPI signal is linear with Fe concentration.