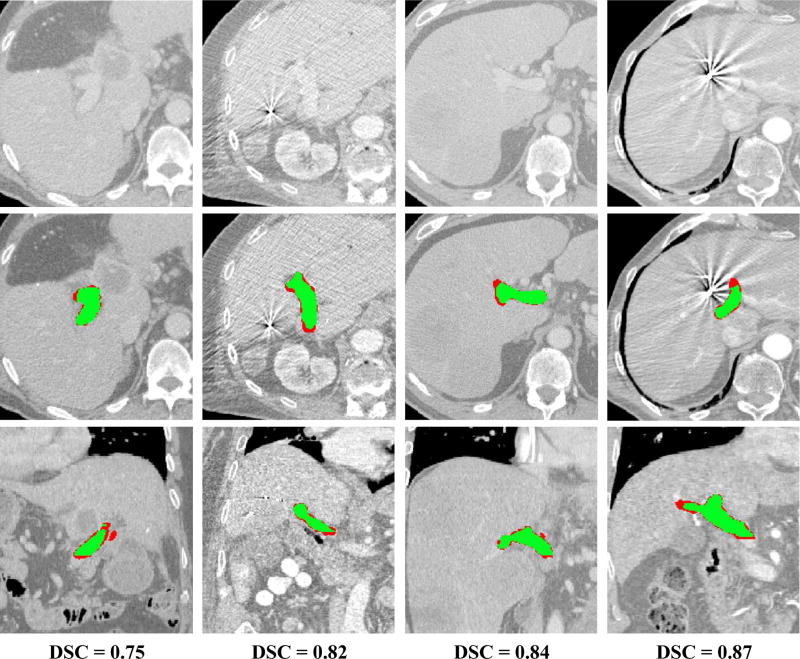
Figure 7.
Examples of segmentation results for four cases from the database. The results are shown in comparison to the original CT images (first raw) using axial (second raw) and coronal (third raw) cross-sections with segmentations. The Dice coefficient for each case is given in the fourth raw. The overlap between manual and automatic segmentation is colored in green, and mis-segmentations are colored in red.

