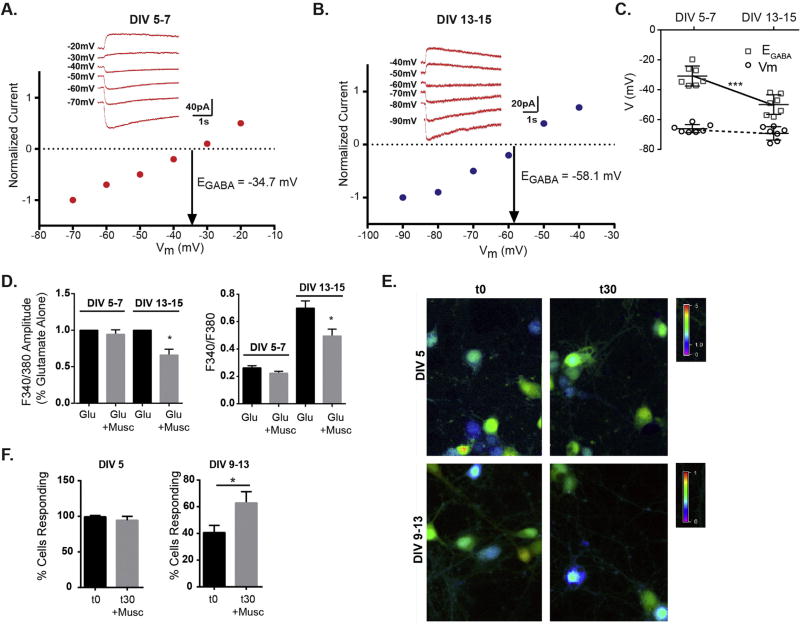
Fig. 2.
Mild GABAAR induced depolarization inhibits neuron excitability. A,B, Representative gramicidin-perforated patch clamp recordings and I–V plots of normalized muscimol-activated currents from neurons in voltage clamp at DIV 5–7 and DIV 13–15. C. The reversal potential for muscimol elicited currents (EGABA) in DIV 13–15 neurons was more negative compared to DIV 5–7 (DIV 5–7 = −30.9 ± 6.7 mV, DIV 13–15 = −50.0 ± 6.6 mV), while resting membrane potential (Vm) was unchanged (DIV 5–7 Vm = −66.1 ± 2.7 mV, DIV 13–15 Vm = −69.2 ± 4.5 mV). Mean ± SD, n = 7 neurons for each age, ***p < 0.001, unpaired t-test. D. Muscimol inhibits the average glutamate response amplitude only in DIV13–15 neurons. Left graph shows response values normalized to glutamate alone response. Right graph gives absolute F 340/F380 values: DIV 5–7 neurons glutamate = 0.26 ± 0.02 vs glutamate + muscimol = 0.22 ± 0.014; DIV 13–15 neurons glutamate = 0.70 ± 0.05 vs glutamate + muscimol = 0.50 ± 0.05. (Mean ± SEM, n = 37–84 neurons, *p < 0.05). E. Representative calcium imaging data at t0 and t30 (after 30 min muscimol treatment). F. The % cells responding at DIV 5 were unchanged by muscimol treatment (n = 89–126 neurons) and the % cells responding increased slightly with muscimol treatment in DIV 9–13 neurons: t0 = 40.6 ± 5, t30 = 62.8 ± 8 (Mean ± SEM, n = 42–82 neurons, *p < 0.05).

