Abstract
Background
The number of adult heart transplant candidates waiting at the “most-urgent” Status 1A has increased over time despite the expansion of geographic sharing of hearts in 2006. We aimed to determine if candidates listed with inotropes contribute to the excess Status 1A candidates.
Methods and Results
The initial registrations of all adult heart-only candidates listed from 2000–2015 were analyzed using the Scientific Registry of Transplant Recipients dataset. Trends in listing Status, justifications, and candidate factors were measured. Adjusted trends in listing Status pre- and post-geographic sharing were estimated using multilevel logistic regression. Competing risks models provided trends in transplant-free waitlist survival. There were 46,853 adult heart-alone listings during 2000–2015. Pre-sharing, Status 1A listing was unchanged over time (aOR 0.98, 95% CI 0.78–1.23). Post-sharing, the adjusted odds of Status 1A listing increased 117% over 9 years (aOR 2.17, 95% CI 1.82–2.58). The number of yearly candidates listed Status 1A with inotropes increased by 193 while the dobutamine, dopamine, and milrinone doses used decreased 49%, 55%, and 29% (p<0.001). The risk of waitlist death or deterioration of Status 1A inotrope candidates relative to Status 2 candidates decreased 62% for 2006–2010 and 70% 2011–2015 compared to 2003–2006.
Conclusions
After the wider geographic sharing of hearts in 2006, transplant programs used multiple inotropes to list candidates at Status 1A more frequently with progressively lower doses. Concurrently, the Status 1A inotrope candidate waitlist outcomes improved substantially. These trends suggest that overtreatment with multiple inotropes contributes to the current critical excess of Status 1A candidates.
Introduction
Heart transplant candidates are given priority for transplant based on “Status”, a three-tiered candidate ranking system designed with the intention of prioritizing medically urgent candidates.1 Status is determined by the therapies a candidate is receiving, based on the premise that candidates nearer death will require more life-sustaining therapies. The highest priority Status 1A patients are expected to have short life expectancies without transplant and must be receiving intensive life support therapy, such as acute mechanical circulatory support or high-dose inotrope therapy.1 In July 2006, the Organ Procurement and Transplant Network (OPTN) expanded the geographic sharing of donor hearts, enlarging the zone of priority for 1A candidates. This policy change met its intended goal of increasing the rate of transplantation for Status 1A candidates.2–4
The adult heart allocation system now faces a new challenge as the total number of candidates both listed and waiting at Status 1A have increased substantially since 2006, despite the geographic sharing policy.5–7 By 2015, 67% of heart transplant recipients were Status 1A at the time of transplant.8 Current explanations for the increase in Status 1A candidates include increased use of continuous-flow left ventricular assist devices (CF-LVADs) and Status 1A exceptions.5,7–10 However, other changes in transplant program listing practice could be contributing to the excess number of Status 1A candidates. It has been suggested that transplant centers have become more likely to “game” the waitlist by using unnecessary multiple inotrope therapy to bump non-urgent candidates up to Status 1A.6,11,12
In this study, we describe trends over time in the use of inotropes to list adult heart transplant candidates and in the medical urgency of candidates listed with inotropes. Specifically, we aimed to determine if less urgent candidates overtreated with high dose or multiple inotropes were significantly contributing to the excess number of Status 1A candidates.
Materials and Methods
Candidate population and data
This study used data from the Scientific Registry of Transplant Recipients (SRTR). The SRTR data system includes data on all donor, wait-listed candidates, and transplant recipients in the US, submitted by the members of the OPTN. The Health Resources and Services Administration, U.S. Department of Health and Human Services provides oversight to the activities of the OPTN and SRTR contractors. Data was collected from the initial registrations of all adult heart-alone US transplant candidates added to the waitlist between 1/1/2000 and 12/31/2015. We limited our analysis to initial registration data, as initial listing represents a standard reference point in the care of advanced heart failure patients and the initial registration forms contain the most complete candidate information.
All available candidate data from the Transplant Candidate Registration (TCR) forms was collected. Medical data included age, weight, height, gender, body mass index, cardiac diagnosis, blood type, renal function, history of diabetes, cerebrovascular disease, malignancy, cardiac surgery, smoking, and defibrillator placement. Functional status was recorded on the Karnofsky 11-point performance status scale which has been validated in heart failure patients.13,14 Socioeconomic variables included citizenship, race, insurance type, education, and work history. Hemodynamic data included cardiac output, pulmonary capillary wedge pressure, pulmonary arterial systolic, diastolic, and mean pressures. Body weight, height, and cardiac output were used to calculate cardiac index for each patient using the DuBois formula for body surface area.15
For 1A candidates listed with the mechanical circulatory support (MCS), the MCS type (VAD, total artificial heart, extracorporeal membrane oxygenation (ECMO), and/or intra-aortic balloon pump) was determined. The MCS justification sub-criterion (acute hemodynamic decompensation, elective 1A time for stable durable LVADs, or objective device malfunction) was also determined. For Status 1A candidates listed with high-dose/multiple inotrope therapy (and not receiving MCS), qualifying hemodynamic data and inotrope doses from the 1A justification form were analyzed. Data entry errors for inotrope doses, which were a priori defined as >200% maximum dose, were excluded.
Statistical Analysis
Trends in listing status and justifying support therapies
Because the geographic sharing policy was implemented on July 12th 2006, we divided the data into the pre-geographic sharing period (July 12th 2000 to July 11th 2006) and post-geographic sharing (July 12th 2006 to July 11th 2015). Trends in initial listing Status, justifications, inotrope doses and candidate characteristics for both time periods were analyzed using non-parametric tests for change in proportions or means by year.16 Because our data consisted of candidates nested within centers, hierarchal logistic regression models with fixed effects by center were estimated for both the pre-geographic sharing and post-geographic sharing time periods to provide adjusted trends in the odds of Status 1A listing over time. We chose center-level fixed effects over random effects in order to control for unmeasured center-specific listing practices that could confound the effect of listing year. This method produces an estimate that can be interpreted as the average within-center effect of time on the odds of listing 1A. We included data from July 12th 2005 to July 11th 2006 in both models, as the year prior to policy implementation is the appropriate reference year for measuring the geographic sharing policy effect. We kept all controlling candidate covariates detailed above in the model except for highly collinear covariates with correlations above 0.7 where we removed the collinear covariate with the highest variance inflation factor. We purposefully did not include supportive therapies a patient was receiving as covariates in the model (e.g. MCS, inotropes, ventilation) as the therapies are part of the causal pathway to Status 1A listing.
To specifically examine trends in the use of inotropes to list candidates at Status 1A, we repeated our analysis for candidates listed with either inotropes or no support (i.e. excluding patients receiving mechanical circulatory support, mechanical ventilation, or granted Status 1A or 1B with exceptions). This subgroup analysis isolates the effect of time on the odds a candidate was listed at Status 1A with inotrope therapy as compared to being listed Status 1B with inotrope therapy or listed at Status 2 with no support. Finally, for comparison, we examined trends in the last status of transplant recipients over time.
Waitlist mortality of Status 1A inotrope candidates over time
We analyzed changes in the risk of candidate death or deterioration on the waitlist of candidates listed Status 1A with inotropes using a Fine-Gray regression with competing risks of transplantation and delisting.17 The Fine-gray subdistribution hazard model directly estimates the ability of Status to predict death or deterioration on the waitlist after accounting for the different rates of transplantation and delisting amongst Status groups.18 We elected not to control for other covariates previously associated with death on the waitlist2,9 as our goal was to analyze Status as a single predictor for urgency. Given the known improvements in the overall waitlist survival of all heart transplant candidates over time7, our main outcome was the sub-hazard ratio of death or deterioration for Status 1A candidates relative to Status 2 candidates. In order to assess trends in waitlist mortality within each time period, we divided both the pre-sharing and post-sharing periods into two equal halves. This approach allowed us to assess Status 1A inotrope candidate waitlist survival in the context of increasing median Status 1A waiting time over time and indirect effects of the expansion of CF-LVAD therapy.7–10,19 Cumulative incidence functions of death or deterioration were estimated for each listing status and time period combination for the first four hundred days after listing. To assess the robustness of our waitlist survival findings, we performed the following sensitivity analyses: we 1) changed the main outcome to death on the waitlist and added delisting due to deterioration as an additional competing risk, 2) added VAD implantation as a competing risk, 3) controlled for known risk factors for death or deterioration on the waitlist, and 4) estimated cause-specific hazard ratios.
All analyses were performed with STATA, version 15 (StataCorp, College Station, Tx). Our study was exempt from institutional review board review as a re-analysis of a publicly available dataset.
Results
Unadjusted and adjusted trends in Status 1A listing and recipients
From 2000–2015, there were 46,853 initial listings for adult heart transplant candidates nationwide and the number of candidates initially listed at Status 1A, 1B, and 2 by year are displayed in Figure 1. Status 1A listings declined from 656 (22% of yearly listings) in 2000 to 452 (18%) in 2006, and then increased to 965 (26%) by 2015. Status 1B listings also increased from 646 (21%) to 1,641 (43%) from 2000 to 2015 while Status 2 listings declined in both absolute and relative terms from 1,673 (55%) to 1,038 (28%). Similar trends were observed in the subgroup of candidates listed with either inotropes or no support (candidate with MCS excluded, N = 34,517, Figure S1). Status 1A inotrope listings decreased from 256 in 2000 (11% of inotrope or no support listings) to 174 (8%) in 2006, then increased to 381 (16%) by 2015. All trends were significant at p<0.001.
Figure 1. The initial listing status of adult, heart-alone candidates by year.
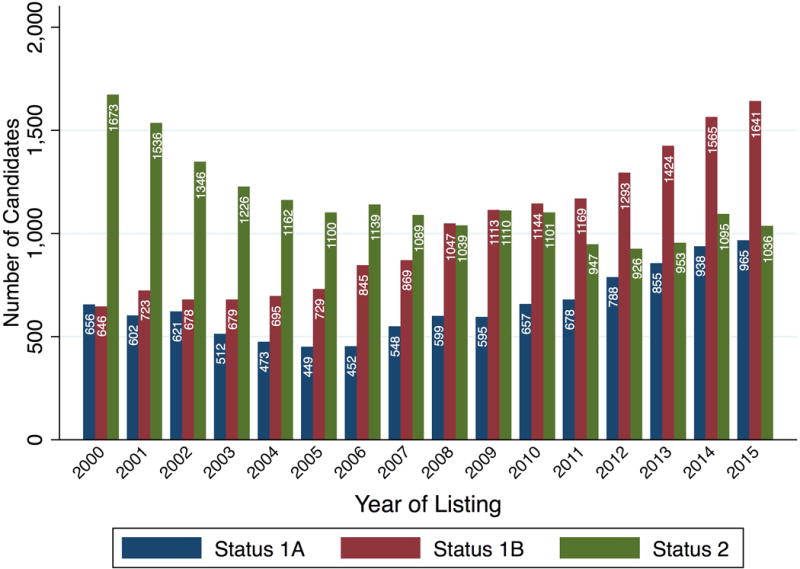
Columns represent number of listings in each Status category during the calendar year. Blue: Status 1A, Red: Status 1B, Green: Status 2. Candidates initially listed inactive were omitted.
The absolute number and proportion of yearly Status 1A recipients was stable from 2000 to 2006. There were 701 Status 1A recipients in 2000 and 694 in 2006, representing 36.6% and 37.0% of yearly transplants (p = 0.78 for trend). The number and proportion of Status 1A more than doubled from 2006 to 2015. There were 689 Status 1A recipients and 1549 in 2015, representing a relative increase from 37% to 66% of all transplants (p<0.001).
There was only sufficient data on MCS at time of transplant to analyze the 2003 to 2006 Status trends for recipients supported with inotropes or no support. There were 264 inotrope-alone Status 1A recipients in 2003 and 304 in 2006, representing 21% and 23% of yearly non-MCS transplants (p=0.49). From 2006 to 2015, number of yearly inotrope-alone Status 1A recipients increased from 304 to 559, representing a relative increase from 23% of all yearly non-MCS transplants to 55% of all yearly non-MCS transplants (p<0.001 for trend).
The results of the multilevel logistic regression models for Status 1A listing can be found in Table 1 and 2. In the pre-geographic sharing period, there was no significant change in the adjusted odds that a transplant program listed a candidate at Status 1A (aOR 0.98, 95% CI 0.78–1.23). However, in the post-geographic sharing period, the adjusted odds that a transplant program listed a candidate Status 1A increased 117% (aOR 2.17, 95% CI 1.82–2.58) over nine years. For candidates listed with either inotropes or no support, there was an 82% increase in the odds of listing Status 1A with inotropes (aOR 1.81, 95% CI 1.39–2.38). Candidate characteristics used in adjusted models are summarized in Table S1 and the full adjusted models can be found in Table S2.
Table 1.
Unadjusted and Adjusted Odds of Status 1A Listing Over Time
| 2005–2006 Vs. 2000–2001 |
2005–2006 Vs. 2000–2001 |
2014–2015 Vs. 2005–2006 |
2014–2015 Vs. 2005–2006 |
|
|---|---|---|---|---|
| Unadjusted | Adjusted for candidate factors | Unadjusted | Adjusted for candidate factors | |
| Status 1A | 0.85 (0.74–0.98) |
0.98 (0.78–1.23) |
1.58 (1.38–1.81) |
2.17 (1.82–2.58) |
| Observations | 15,632 | 11,730 | 30,243 | 24,949 |
95% CI in parentheses. Fixed effects by center were used for all models. Year ranges refer to one year period beginning on July 12th of the first year, e.g. 2000–2001 refers to July 12th 2000 to July 11th 2001. Expanded geographic sharing of donor hearts began on July 12th 2006.
See table S2 for full adjusted models. Candidate location (hospitalized, in ICU, or home) was only included in the 2000–2006 models, due to the missing data in 2006–2015. Candidate functional status, smoking history, and work history were only recorded after 2004, so these variables were only included in the 2006–2015 models.
Table 2.
Unadjusted and Adjusted Odds Ratio for Status 1A Inotrope Listing* Over Time
| 2005–2006 Vs. 2000–2001 |
2005–2006 Vs. 2000–2001 |
2014–2015 Vs. 2005–2006 |
2014–2015 Vs. 2005–2006 |
|
|---|---|---|---|---|
| Unadjusted | Adjusted for candidate factors | Unadjusted | Adjusted for candidate factors | |
| Status 1A | 0.83 (0.68–1.02) |
0.75 (0.54–1.03) |
1.68 (1.37–2.07) |
1.82 (1.39–2.38) |
| Observations | 12,628 | 9,763 | 20,965 | 18,015 |
95% CI in parentheses. *Excluding candidates receiving mechanical circulatory support, mechanical ventilation or listed Status 1A/1B by exception. Fixed effects by center were used for all models. Year ranges refer to one year period beginning on July 12th of the first year, e.g 2000–2001 refers to July 12th 2000 to July 11th 2001. Expanded geographic sharing of donor hearts began on July 12th 2006.
See table S2 for full adjusted models. Candidate location (hospitalized, in ICU, or home) was only included in the 2000–2006 models, due to the missing data in 2006–2015. Candidate functional status, smoking history, and work history were only recorded after 2004, so these variables were only included in the 2006–2015 models.
Trends in justifications for Status 1A listings for 2006–2015
The support therapies used to justify the new Status 1A listings from 2006–2015 are displayed in Figure 2 relative to baseline levels in 2005. The largest driver of the increase in Status 1A listing was CF-LVAD therapy. There were 220 additional candidates supported with CF-LVADs listed at Status 1A in 2015 compared to 2005. However, multiple inotrope therapy was also used much more frequently over time. There were an additional 153 candidates listed Status 1A with multiple inotropes in 2015 compared to 2005 Status 1A listings. Other justifications that contributed to the increase include single high dose inotropes (40 additional yearly listings), ECMO (41 additional yearly listings), and Status 1A exceptions (38 additional yearly listings). All trends noted above were significant at p <0.001. For other therapy types, there was no statistically significant consistent trend towards increased use over the time period (e.g. p = 0.35 for IABP).
Figure 2. Justifications for Status 1A listings relative to 2005 levels.
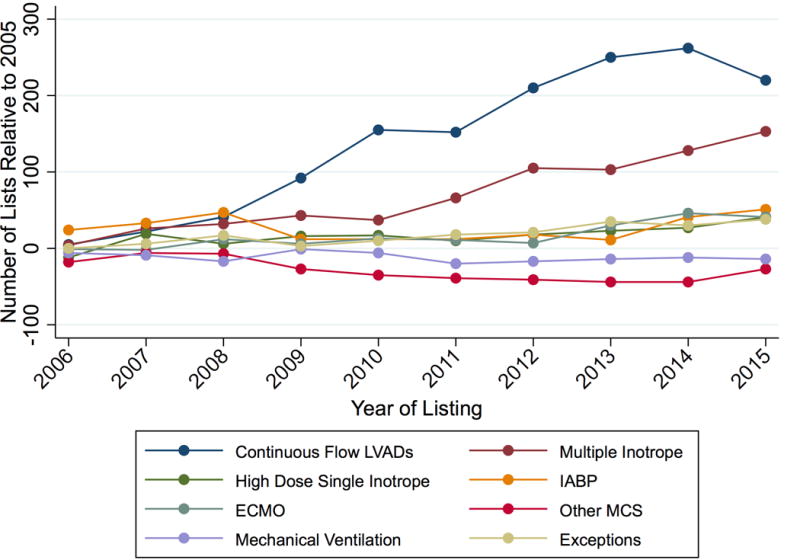
Y-axis represents the absolute change in number of Status 1A justifications relative to 2005 levels.
Inotrope doses and hemodynamics of high-dose & multiple inotrope Status 1A candidates
For Status 1A candidates listed using high-dose or multiple inotropes as justification (not receiving MCS), hemodynamic data was available beginning in 2005 and was present for 2,640 out of 2,888 candidates listed from 2005–2015. 94% of all hemodynamic measurements were obtained on inotropes; this did not change significantly over time (p =0.2). Only three candidates were excluded for errors in milrinone dose entry. The mean dobutamine, dopamine, and milrinone doses of multiple inotrope candidates decreased 49%, 55%, and 29% (p<0.001 for each drug) while cardiac index increased from 2.17 to 2.25 L/min/m2 (p= 0.044) (Figure 3). Use of each inotrope type was relatively stable and all other measured hemodynamic parameters improved (Figure S2–S3).
Figure 3. Mean inotrope doses and hemodynamics for multiple inotrope Status 1A candidates listed 2005–2015.
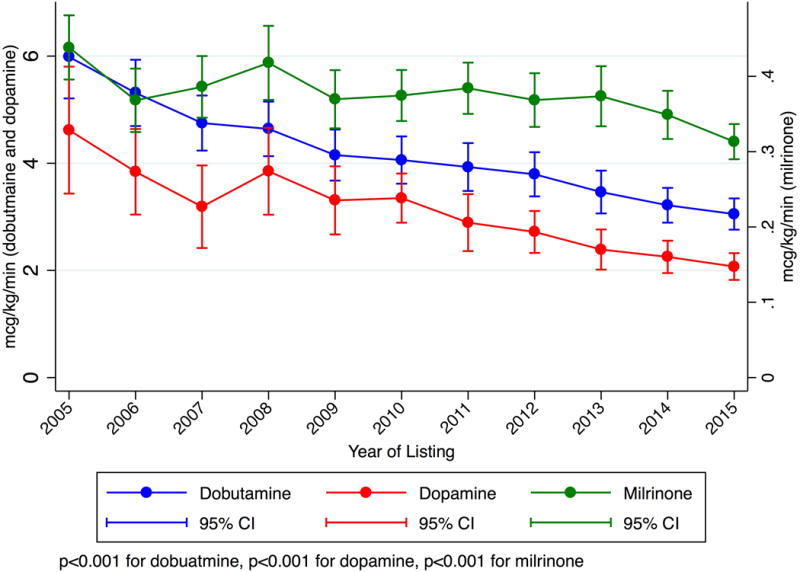
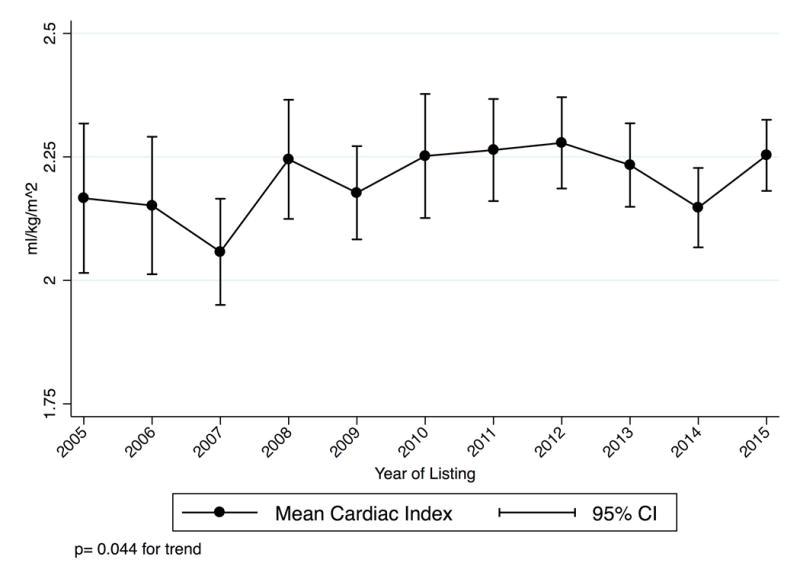
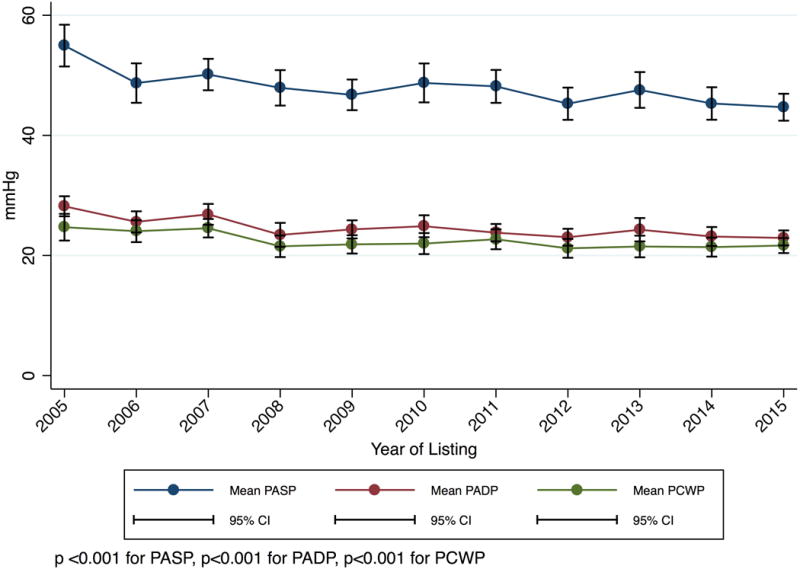
These candidates did not have MCS and were listed with a continuous infusion of multiple inotropes with hemodynamic monitoring. P-values are for trends from 2005–2015. Panel A: Inotrope Doses. Panel B: Cardiac Index. Panel C: Mean Pulmonary Artery Systolic, Diastolic, and Wedge Pressure.
In contrast, candidates listed with a single high dose inotrope had relatively stable inotrope doses over time, the mean dose of high dose dobutamine dose candidates declined 4% (p= 0.005) while the milrinone dose was unchanged (p=0.63) (Figure S4). There was a trend towards more milrinone use (+10%, p =0.01) (Figure S5). Similar to the multiple inotrope candidates, the mean cardiac index of these candidates increased 6% (from 2.04 to 2.17 L/min/m2, p = 0.001) and other measured hemodynamic parameters improved (Figure S6).
Waitlist Survival of Inotrope Candidates
In the two pre-geographic sharing time periods, Status 1A inotrope candidates had a 130% and 95% higher risk of dying or delisting due to illness than Status 2 candidates (Table 3, Figure 4, Table S3). However, immediately post-geographic sharing (July 12th 2006–Dec 31st 2010), the risk of death or deterioration for Status 1A inotrope candidates was only 33% higher than Status 2 candidates (sub-hazard ratio 1.33, 95% CI 1.08–1.63), representing a 62% reduction in risk when compared to the last three years pre-geographic sharing (July 12th 2003–July 11th 2006). During Jan 1st 2011- July 11th 2015th, Status 1A inotrope candidates had a 25% higher risk of death or deterioration than Status 2 candidates (sub-hazard ratio 1.25, 95% CI 1.07 – 1.47), representing a 70% reduction in risk relative to pre-sharing. There was small but statistically significant trend towards subsequent VAD implantation amongst candidates initially listed Status 1A with inotropes alone across the four time periods (19.2%, 22.8%, 23.5%, 23.2%, p <0.001 for trend). However, a similar pattern of reduction of relative Status 1A mortality was observed in all sensitivity analyses, including adding VAD implantation as a competing risk (Table S4–S7).
Table 3.
Sub-Hazard Ratios for Death or Delisting Due to Illness for Adult Heart Transplant Candidates listed inotropes or no support, 2000–2015.
| Pre-geographic sharing policy | Post-geographic sharing policy | |||
|---|---|---|---|---|
| July 12th 2000–July 11th 2003 | July 12th 2003–July 11th 2006 | July 12th 2006–Dec. 31th 2010 | Jan 1st 2011–July 11th 2015 | |
| Status 1A inotrope vs Status 1B inotrope | 1.44 (1.19–1.76) |
1.22 (0.96–1.56) |
1.01 (0.82–1.24) |
1.18 (1.01–1.38) |
| Status 1A inotrope vs Status 2 | 2.30 (1.92–2.75) |
1.95 (1.53–2.48) |
1.33 (1.08–1.63) |
1.25 (1.07–1.47) |
| Status 1B inotrope vs Status 2 | 1.59 (1.38–1.84) |
1.60 (1.35–1.88) |
1.32 (1.16–1.51) |
1.06 (0.94–1.19) |
| Total Listings | 8,159 | 5,876 | 9,572 | 10,910 |
Sub-hazard ratios estimated with a Fine-Gray competing risks regression model (see Table S3 for full model results). 95% CI in parentheses.
Figure 4. Cumulative incidence function for death or deterioration on the waitlist by year and initial listing status.
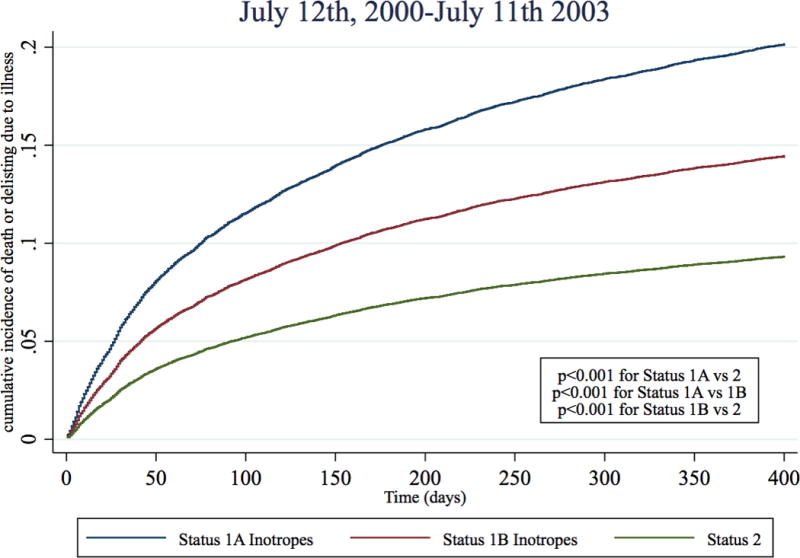
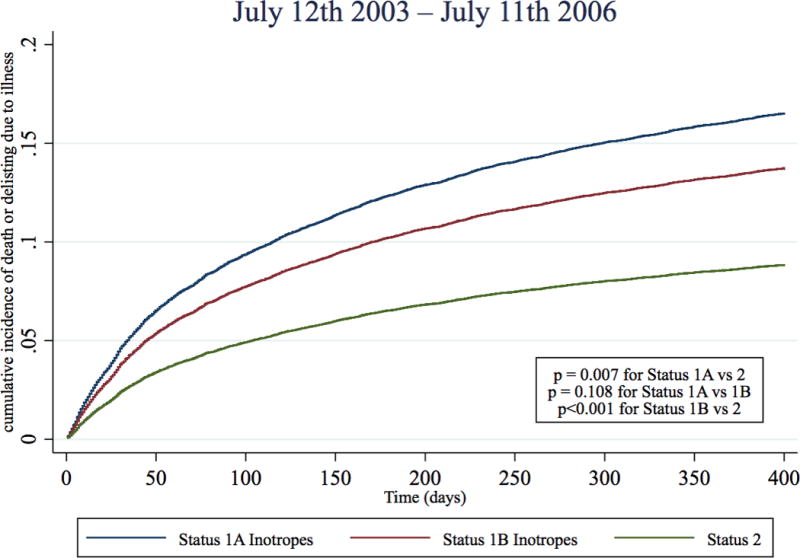
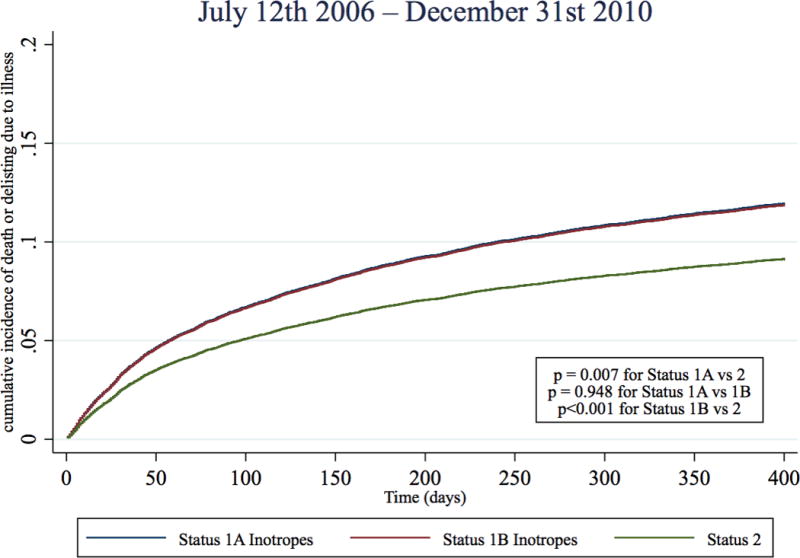
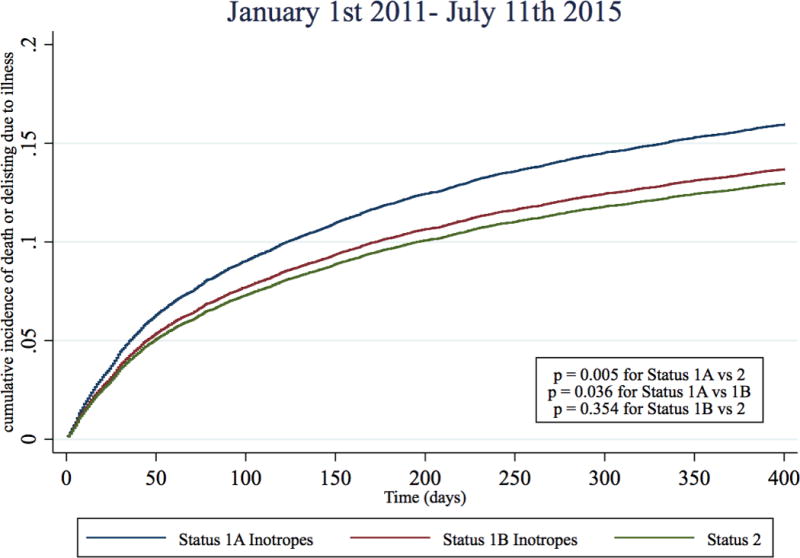
Cumulative incidence functions of death or deterioration (delisting due to worsening illness) were estimated for each status and time period combination with competing risks of transplantation and delisting (not from deterioration). Blue: Status 1A Inotrope, Red: Status 1B inotrope, Green: Status 2
Discussion
In this analysis of all 46,853 adults listed for heart-alone transplantation from 2000–2015, we show that the odds that a transplant program used inotropes to list a heart transplant candidate Status 1A increased 82% since expansion of geographic sharing of hearts in 2006. Multiple inotrope listings drove this trend, responsible for over one hundred fifty of the excess Status 1A candidates listed each year. During this time period, the cardiac index of these candidates increased only slightly despite a large decrease in inotrope dose. The transplant-free waitlist survival of Status 1A inotrope candidates substantially improved to relative to Status 2 candidates. Taken together, these trends indicate that overtreatment of less urgent heart transplant candidates with multiple inotropes contributes significantly to the current excess number of Status 1A candidates.
Prior to our report, the preponderance of Status 1A candidates currently on the waitlist has mainly been attributed to improvements in mechanical circulatory support, specifically CF-LVADs. Therefore it has been assumed that these CF-LVAD candidates are the main drivers of the “dilution” of Status 1A urgency.6,9,20 However, we demonstrate that the trend towards excess 1A listings was also driven in large part by increases in the rate of listing multiple inotrope candidates. In our multivariate logistic regression model, this trend towards Status 1A listing with inotropes could not be explained by changes in any candidate factors or center level effects. This result implies that the trend towards Status 1A inotrope use is best described as a change in average listing practice within centers over time.
After establishing that Status 1A inotrope listings significantly increased, we investigated trends in the medical urgency of these candidates over the same time period. Physiologically, we found the inotrope doses used to list these multiple inotrope candidates declined substantially (29–55%) while the cardiac index and filling pressures of these candidates improved. This trend towards improved physiology was paired with substantial reductions in the risk of death or deterioration as estimated by a competing risks model. Interestingly, the trend towards improved absolute 1A inotrope candidate waitlist outcomes reversed somewhat during 2011–2015. Possible explanations for this shift include a significantly longer median waiting time for 1A candidates (87 days for 2011–2014 vs. 67 and 64 for 2007–2010 and 2003–2006)19 and/or more frequent delisting in favor of CF-LVAD placement.
We believe the most likely explanation for these findings is a shift in transplant program listing practice over time. Specifically, it appears programs are overtreating less urgent candidates with multiple inotropes in order to obtain 1A Status. Increased competition for transplantable hearts is a plausible explanation for this behavior. Competition likely increased due to both the broader geographic sharing of hearts in 2006 and an influx of CF-LVAD candidates around 2010, incentivizing the use of multiple inotrope therapy to upgrade the initial status of candidates to the more competitive Status 1A. Regardless of the exact mechanism, the net effect of both the trend towards increased CF-LVAD and multiple inotrope use is a breakdown of the supposed urgency-based stratification of adult heart transplant candidates. The Final Rule, issued by the department of health and human services, requires that allocation systems rank candidates “from most to least medically urgent”.21 Undoubtedly, there are truly critically ill candidates being listed urgently with multiple inotropes. However, our data suggest that these truly sick candidates may not receive the priority for transplantation they deserve because they must compete with less urgent candidates.
Our results have implications for the recently accepted six-Status allocation system, which breaks Status 1A up in to three new Status levels in an effort to alleviate the excess of Status 1A candidates.8 In December 2016, hemodynamic and inotrope requirements were added to this proposal. We have recently shown that at least 74% of multiple inotrope candidates listed from 2010–2015 will be disqualified from high priority listing status by this “shock” requirement.22 At face value, this shock requirement appears to be a solution to the problematic trends toward overtreatment with inotropes described in this paper. However, as stated by the OPTN, the expected impact of the shock requirement is “based on current behavior and practices, and [this has raised concern] that the proposal would influence practitioners to behave differently than they currently do.”8 We believe it unlikely that transplant programs that currently overtreat with multiple inotropes will passively accept the new rules and compliantly list the majority of their candidates at Status 6. Rather, we agree with others that predict transplant centers will shift practices once again and use surgically placed mechanical circulatory support devices, as these therapies are exempt from the shock requirement.12
Study limitations
Our analysis has several limitations. First, while the SRTR database contains a record of all candidates listed for heart transplantation, we do not have data on all the patients with advanced heart failure who would benefit from transplant. Therefore, our conclusions only apply to the population of candidates fortunate enough to be listed for heart transplantation, not all those that could potentially benefit. Second, we may be missing candidate characteristics in our data that might explain the increase in multiple inotrope use for Status 1A listing. Third, the effect of improved heart failure therapies in general from 2000–2015 has led to improvements in survival in advanced heart failure patients, which make interpretation of the relative improvement in Status 1A inotrope candidate waitlist outcomes difficult.
Conclusions
After the wider geographic sharing of hearts in 2006, transplant program used inotropes to list adult heart transplant candidates at Status 1A much more frequently. Multiple inotrope listings were responsible for over 150 excess Status 1A listings in 2015 compared to 2006. During this time period, the cardiac index of these patients increased slightly despite up to a 55% decrease in inotrope dose. After geographic sharing, Status 1A inotrope candidates were over 60% less likely die or deteriorate on the waitlist relative to Status 2 candidates. Overtreatment of less urgent adult heart candidates with multiple inotropes contributes significantly to the current excess of Status 1A candidates.
Supplementary Material
Clinical Perspective.
What is new?
This study demonstrates inotrope therapy is an important contributor to the current excess of Status 1A adult heart transplant candidates.
The number of candidates being listed Status 1A with inotropes is increasing while the doses of inotropes have declined.
Status 1A inotrope candidates now survive substantially longer on the waitlist relative to Status 2 candidates compared to a decade ago, implying these candidates have become less urgent over time.
What are the clinical implications?
If candidates that “should be” listed Status 1B or 2 are instead being overtreated and listed Status 1A with inotropes, this practice may compromise the fairness and effectiveness of both the current heart allocation system and the modified system awaiting implementation.
Alternative heart allocation systems that do not rely on therapy as a proxy for urgency should be developed.
Acknowledgments
The authors would like to acknowledge Jon Grinstein, Nikhil Narang, Catherine Murks and Nir Uriel for their assistance with the project by providing relevant clinical information. The data reported here have been supplied by the Minneapolis Medical Research Foundation (MMRF) as the contractor for the Scientific Registry of Transplant Recipients (SRTR). The interpretation and reporting of these data are the responsibility of the authors and in no way should be seen as an official policy of or interpretation by the SRTR or the U.S. Government. 2016.
Sources of Funding: Supported in part by institutional Clinical and Translational Science Award grant UL1 RR024999; PI: Dr. Julian Solway. William Parker is supported by a NIH T32 Training Grant, number 5T32HL007605-32. Mathew Churpek is supported by a NIH K08 HL121080-03 Grant.
Footnotes
Disclosures: None
References
- 1.Organ Procurement and Transplant Network Policy 6: Allocation of Hearts and Heart-Lungs. https://optn.transplant.hrsa.gov/media/1200/optn_policies.pdf#nameddest=Policy_06. Accessed 2016 Dec 10.
- 2.Singh TP, Almond CS, Taylor DO, Graham DA. Decline in Heart Transplant Wait List Mortality in the United States Following Broader Regional Sharing of Donor Hearts. Circ Heart Fail. 2012;5:249–258. doi: 10.1161/CIRCHEARTFAILURE.111.964247. [DOI] [PubMed] [Google Scholar]
- 3.Nativi JN, Kfoury AG, Myrick C, Peters M, Renlund D, Gilbert EM, Bader F, Singhal AK, Everitt M, Fisher P, Bull DA, Selzman C, Stehlik J. Effects of the 2006 U.S. thoracic organ allocation change: analysis of local impact on organ procurement and heart transplantation. J Heart Lung Transplant. 2010;29:235–239. doi: 10.1016/j.healun.2009.05.036. [DOI] [PubMed] [Google Scholar]
- 4.Schulze PC, Kitada S, Clerkin K, Jin Z, Mancini DM. Regional differences in recipient waitlist time and pre- and post-transplant mortality after the 2006 United Network for Organ Sharing policy changes in the donor heart allocation algorithm. JACC Heart Fail. 2014;2:166–177. doi: 10.1016/j.jchf.2013.11.005. [DOI] [PMC free article] [PubMed] [Google Scholar]
- 5.Johnson MR, Meyer KH, Haft J, Kinder D, Webber SA, Dyke DB. Heart transplantation in the United States, 1999–2008. Am J Transplant. 2010;10:1035–1046. doi: 10.1111/j.1600-6143.2010.03042.x. [DOI] [PubMed] [Google Scholar]
- 6.Stevenson LW. The urgent priority for transplantation is to trim the waiting list. J Heart Lung Transplant. 2013;32:861–867. doi: 10.1016/j.healun.2013.06.018. [DOI] [PubMed] [Google Scholar]
- 7.Colvin M, Smith JM, Skeans MA, Edwards LB, Callahan ER, Snyder JJ, Israni AK, Kasiske BL. Heart. Am J Transplant. 2016;16:115–140. doi: 10.1111/ajt.13670. [DOI] [PubMed] [Google Scholar]
- 8.Proposal to Modify the Adult Heart Allocation System. https://optn.transplant.hrsa.gov/media/2006/thoracic_brief_201612.pdf. Accessed 2016 Mar 12.
- 9.Wever-Pinzon O, Drakos SG, Kfoury AG, Nativi JN, Gilbert EM, Everitt M, Alharethi R, Brunisholz K, Bader FM, Li DY, Selzman CH, Stehlik J. Morbidity and mortality in heart transplant candidates supported with mechanical circulatory support: is reappraisal of the current United network for organ sharing thoracic organ allocation policy justified? Circulation. 2013;127:452–462. doi: 10.1161/CIRCULATIONAHA.112.100123. [DOI] [PMC free article] [PubMed] [Google Scholar]
- 10.Slaughter MS, Rogers JG, Milano CA, Russell SD, Conte JV, Feldman D, Sun B, Tatooles AJ, Delgado RMI, Long JW, Wozniak TC, Ghumman W, Farrar DJ, Frazier OH. Advanced Heart Failure Treated with Continuous-Flow Left Ventricular Assist Device. N Engl J Med. 2009;361:2241–2251. doi: 10.1056/NEJMoa0909938. [DOI] [PubMed] [Google Scholar]
- 11.Should Doctors Game The Transplant Wait List To Help Their Patients? NPR.org. http://www.npr.org/sections/health-shots/2016/07/24/486787474/should-doctors-game-the-transplant-wait-list-to-help-their-patients. Accessed 2016 Sep 27.
- 12.Stevenson LW, Kormos RL, Young JB, Kirklin JK, Hunt SA. Major advantages and critical challenge for the proposed United States heart allocation system. J Heart Lung Transplant. 2016;35:547–549. doi: 10.1016/j.healun.2016.04.001. [DOI] [PubMed] [Google Scholar]
- 13.Johnson MJ, Bland JM, Davidson PM, Newton PJ, Oxberry SG, Abernethy AP, Currow DC. The relationship between two performance scales: New York Heart Association Classification and Karnofsky Performance Status Scale. J Pain Symptom Manage. 2014;47:652–658. doi: 10.1016/j.jpainsymman.2013.05.006. [DOI] [PubMed] [Google Scholar]
- 14.Karnofsky DA, Burchenal JH. The Clinical Evaluation of Chemotherapeutic Agents in Cancer. In: MacLeod CM, editor. Evaluation of Chemotherapeutic Agents. Columbia University Press; New York: 1949. p. 196. [Google Scholar]
- 15.Dubois D, Dubois E. Clinical calorimetry. A formula to estimate the approximate surface area if height and weight be known. Arch Intern Med. 1916;17:863–871. [Google Scholar]
- 16.Cuzick J. A Wilcoxon-type test for trend. Stat Med. 1985;4:87–90. doi: 10.1002/sim.4780040112. [DOI] [PubMed] [Google Scholar]
- 17.Fine JP, Gray RJ. A Proportional Hazards Model for the Subdistribution of a Competing Risk. J Am Stat Assoc. 1999;94:496–509. [Google Scholar]
- 18.Austin PC, Lee DS, Fine JP. Introduction to the Analysis of Survival Data in the Presence of Competing Risks. Circulation. 2016;133:601–609. doi: 10.1161/CIRCULATIONAHA.115.017719. [DOI] [PMC free article] [PubMed] [Google Scholar]
- 19.National Data - OPTN. https://optn.transplant.hrsa.gov/data/view-data-reports/national-data/#. Accessed 2017 Jun 22.
- 20.Dardas T, Mokadam NA, Pagani F, Aaronson K, Levy WC. Transplant registrants with implanted left ventricular assist devices have insufficient risk to justify elective organ procurement and transplantation network status 1A time. J Am Coll Cardiol. 2012;60:36–43. doi: 10.1016/j.jacc.2012.02.031. [DOI] [PubMed] [Google Scholar]
- 21.Health Resources and Services Administration (HRSA), Department of Health and Human Services (HHS) Organ procurement and transplantation network. Final rule. Fed Regist. 2013;78:40033–40042. [PubMed] [Google Scholar]
- 22.Parker WF, Garrity ER, Fedson S, Churpek MM. Potential impact of a shock requirement on adult heart allocation. J Heart Lung Transplant. 2017;36:1013–1016. doi: 10.1016/j.healun.2017.05.015. [DOI] [PMC free article] [PubMed] [Google Scholar]
Associated Data
This section collects any data citations, data availability statements, or supplementary materials included in this article.


