
Figure 3. Mean inotrope doses and hemodynamics for multiple inotrope Status 1A candidates listed 2005–2015.
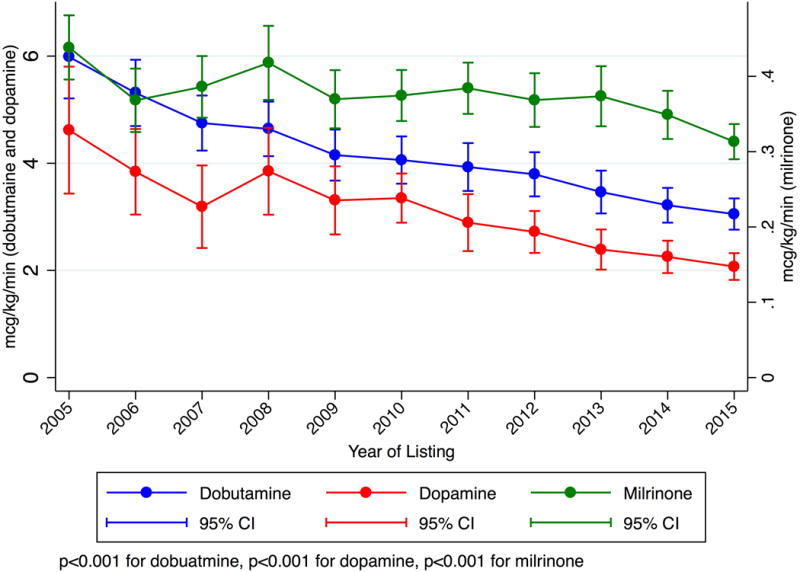
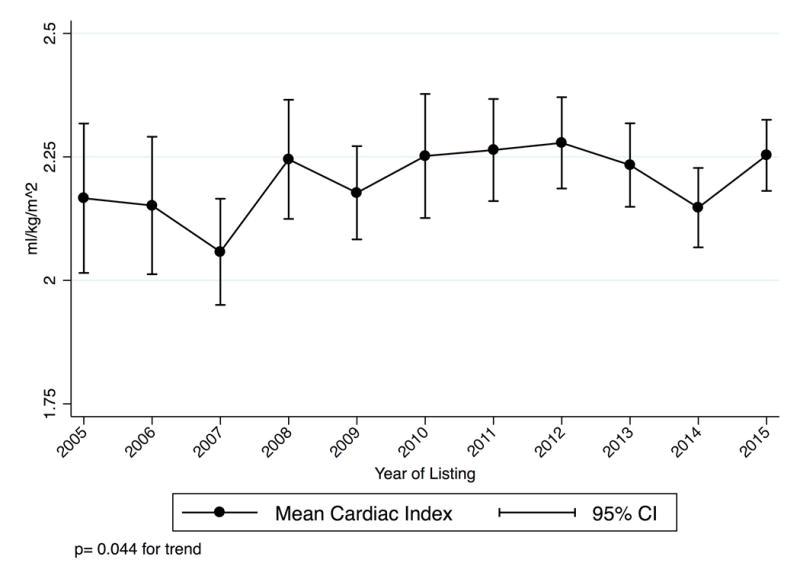
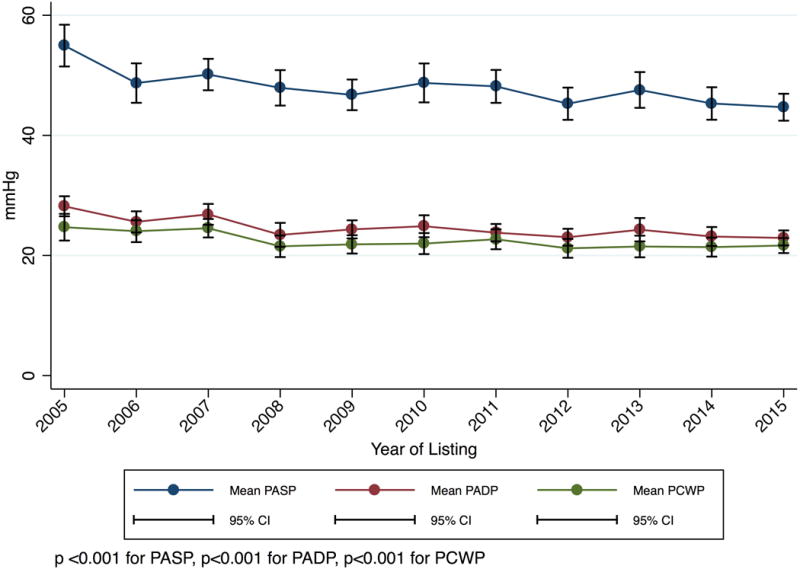
These candidates did not have MCS and were listed with a continuous infusion of multiple inotropes with hemodynamic monitoring. P-values are for trends from 2005–2015. Panel A: Inotrope Doses. Panel B: Cardiac Index. Panel C: Mean Pulmonary Artery Systolic, Diastolic, and Wedge Pressure.