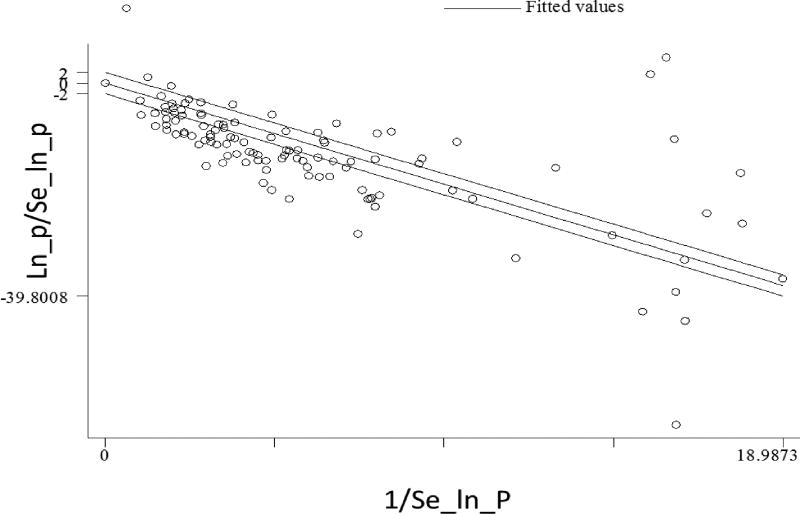
Figure 2. Galbraith plot for assessing bovine tuberculosis study reports heterogeneity in Ethiopia.
The plot is a scatter plot of standardized effect estimates against inverse standard error. In such graphical assessment points outside the confidence bounds (positioned 2 units above and below the regression line) are study reports which have major contribution to heterogeneity noted. In the absence of heterogeneity we could expect all points to lie within the confidence limits. This is one of the evidence for choosing random effect model as opposed to fixed effect model for pooled estimate made in meta-analysis.

