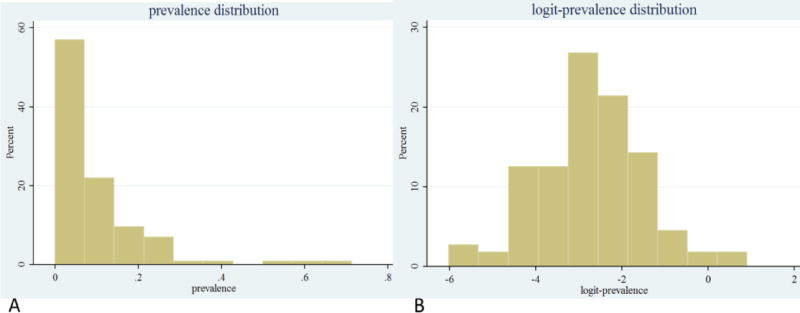
Figure 3. Apparent (A) and logit-prevalence (B) estimate distributions for the animal-level studies of bovine tuberculosis prevalence in Ethiopia.
The right skewed histogram (figure 3.A), illustrates distribution pattern of apparent prevalence reports, while figure 3.B is a normalized one, following logit-transformation of each prevalence estimate up on which all the analyses were made.

