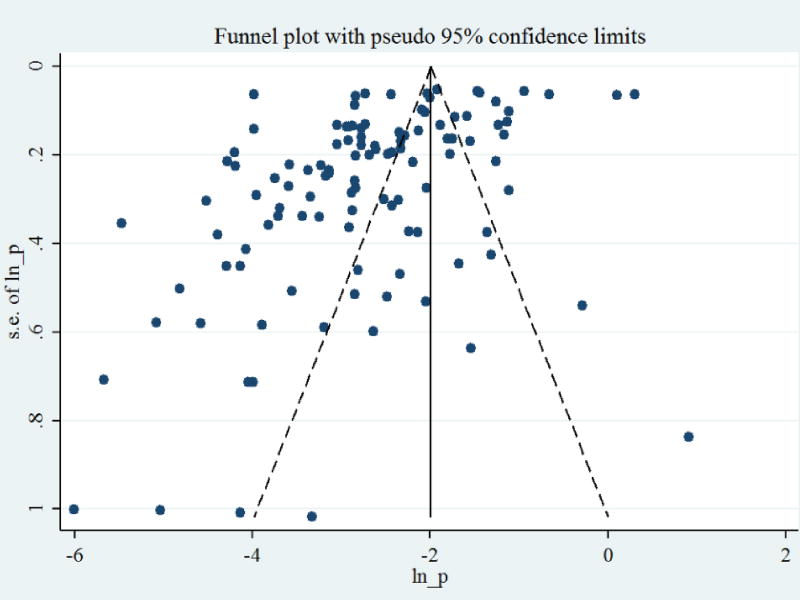
Figure 5. Funnel plot of logit-prevalence estimate of bovine tuberculosis in Ethiopia.
The figure displays each study’s estimated effect plotted against its SE and evaluates the relationship between study results and their precision. The lack of symmetry around the inverted funnel plot illustrates the presence of potential bias due to increasing number of study reports with low prevalence and study reports based on smaller sample size.

