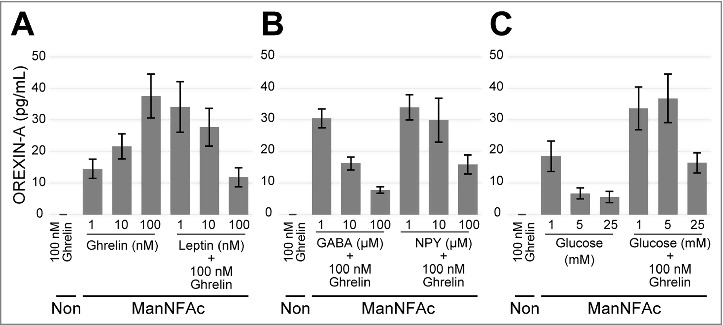
Figure 3.

Acute response of ManNFAc-treated cells to neural and peripheral metabolic signals. (A-C) Responses of ManNFAc-treated cells to metabolic signals. The cells were incubated for 3 h with various doses of ghrelin, leptin (A), GABA, Neuropeptide Y (NPY) (B), and glucose (C). OREXIN-A in the medium was evaluated using an ELISA. Means ± SD (n = 3). Non, non-treated neural cell. Responses of ManNAc-treated cells are shown in Fig. S2.
