Figure 5.

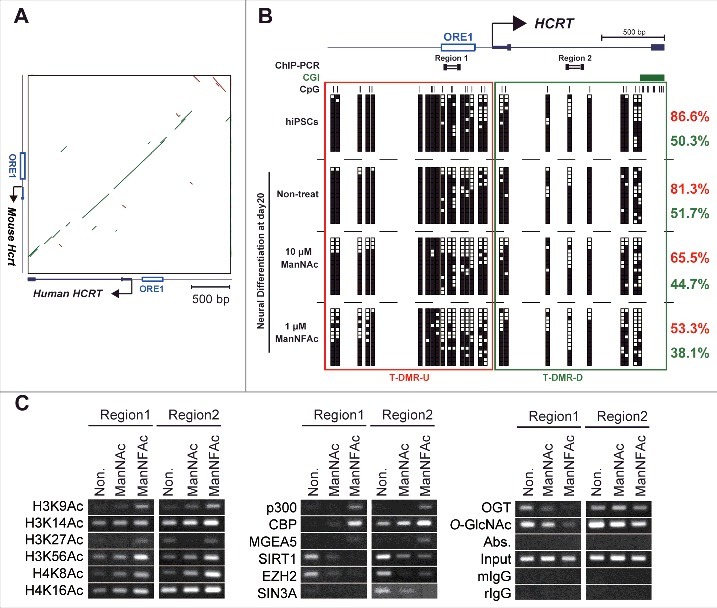
Epigenetic changes at the HCRT gene locus from hiPSCs to hiONs. (A-C) Epigenetic analysis of the HCRT gene locus around the transcriptional start site (TSS). Genomic sequence of HCRT gene loci around the TSS are conserved in human and mouse (A). The green bar and the brown bar indicate forward and reverse complement alignments, respectively. Dot plots were generated using the YASS program65 with the E-value threshold set at 1 × 10⁻⁸. DNA methylation status of HCRT gene around the TSS in hiPSCs, non-orexin neural cells (non-treat), and hiONs induced by ManNAc or ManNFAc (B). Top. Schematic diagram of the genes. ORE1 indicates orexin regulatory element 1. The vertical lines denote the positions of the cytosine residues of the CpG sites. Bottom. Open and filled squares represent unmethylated and methylated cytosines, respectively. Neural cells at day 20 were derived from hiPSCs by supplementation with 10 μM ManNAc and 1 μM ManNFAc. The red and green letters indicate the levels of DNA methylation (%) at T-DMR-U (red square) and T-DMR-D (green square), respectively. ChIP assays to determine histone acetylation and epigenetic regulators were performed focusing on Regions 1 and 2 (upper diagram in Fig. 5B) (C). ChIP assays for O-GlcNAcylation were performed using the antibody RL2.
