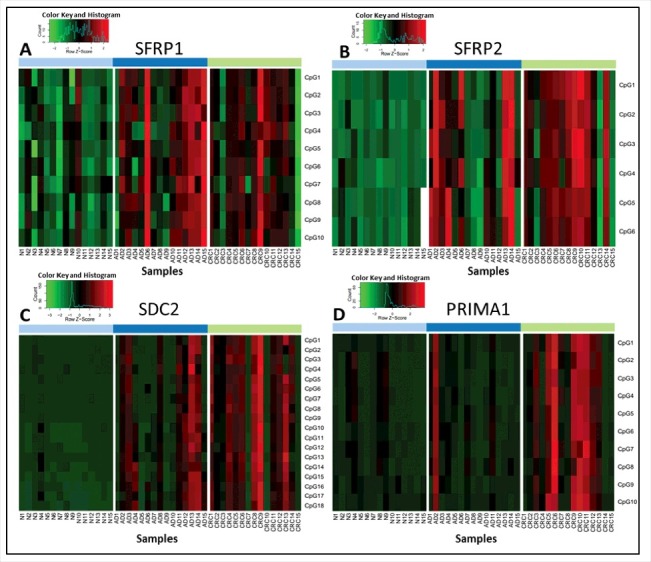
Figure 1.

Methylation percentage data of selected CpG sites of the 4 markers analyzed by pyrosequencing method. Heatmaps representing the methylation pattern of each CpG site of SFRP1 (A), SFRP2 (B), SDC2 (C), and PRIMA1 (D) separately in colon tissue samples using a bisulfite pyrosequencing method. Methylation levels on the color scale are as follows: red: high methylation; black: intermediate methylation; green: low methylation level. Samples are presented in columns. Clinical groups are color coded on the top blocks and represent normal (light blue), adenoma (dark blue), and CRC (light green) tissue samples. CpG sites are shown in rows, indicated on the right side of each panel. Significantly higher methylation levels were observed for 43 of the 44 studied CpG sites located in the promoter regions of SFRP1, SFRP2, SDC2, and PRIMA1 in CRC tissue samples compared with healthy controls, and 33 CpG sites had elevated methylation level in adenomas in comparison to normal samples (P < 0.05). N: normal; AD: adenoma; CRC: colorectal cancer; CpG: cytosine phosphate guanine
