
Figure 2.
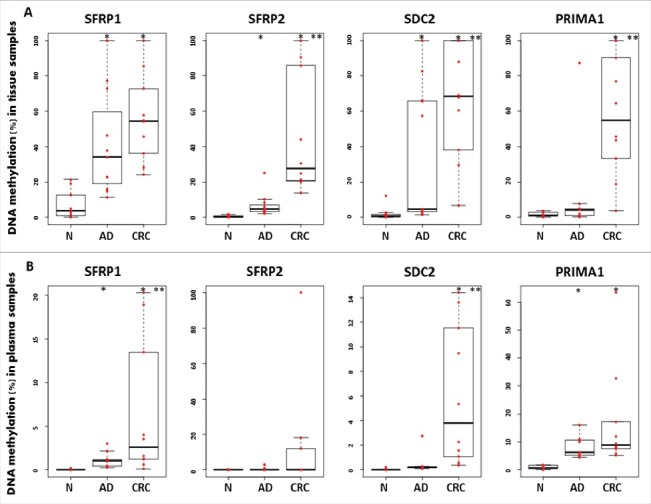
Illustration of DNA methylation differences for the 4 markers in colonic biopsies and paired plasma samples using MethyLight assays. Boxplots illustrate the methylation percentage data of SFRP1, SFRP2, SDC2, and PRIMA1 in colonic tissue (A) and paired plasma (B) samples. Red dots indicate individual DNA methylation percentage values, and the boxplots show the median and standard deviation of the data. Asterisks (*) represent significant differences (P < 0.05) for the adenoma vs. normal and tumor vs. normal comparisons; double asterisks (**) indicate significance (P < 0.05) in tumor samples compared with adenomas. The methylation status of all 4 markers presented a continuous increase during normal-adenoma-carcinoma sequence in tissue samples. Plasma samples showed similar trend; however, lower methylation percentages were observed. N: normal; AD: adenoma; CRC: colorectal cancer