
Figure 1.
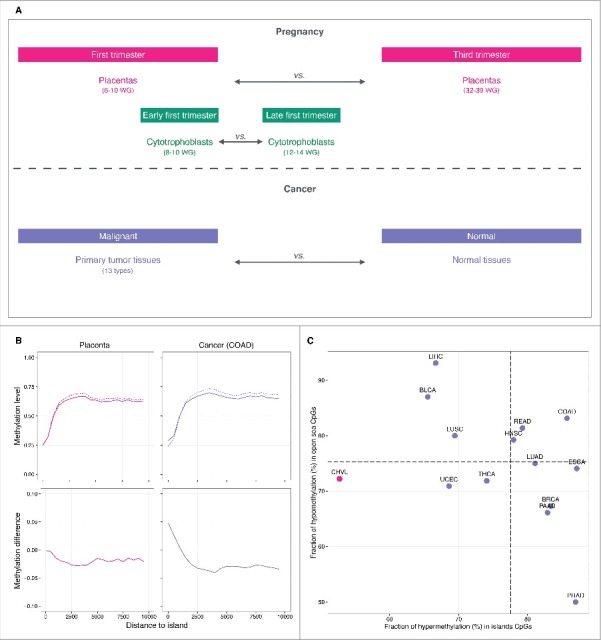
Comparison of DNA methylation in placenta and cancer. (A) Design of the study. (B) Top: methylation level plotted against the distance to the nearest CpG island. In pink, the solid line denotes first trimester and the dashed line denotes third trimester chorionic villi samples. In purple, the solid line denotes colon adenocarcinoma tumor samples and the dashed line denotes corresponding normal tissue samples. Bottom: methylation difference in first vs. third trimester chorionic villi samples (pink) and tumor vs. normal tissue samples (purple). (C) Fraction of hypermethylation (hypermethylation alterations / total alterations) in island CpGs (x-axis) vs. fraction of hypomethylation (hypomethylation alterations / total alterations) in open sea CpGs (y-axis) in placenta (pink) and cancer samples (purple). CpGs were classified as altered if they displayed an absolute methylation difference >0.05 with a FDR q-value < 0.05. Horizontal and vertical dashed lines represent average fractions in cancer. Abbreviations as in Table 1.