
Figure 2.
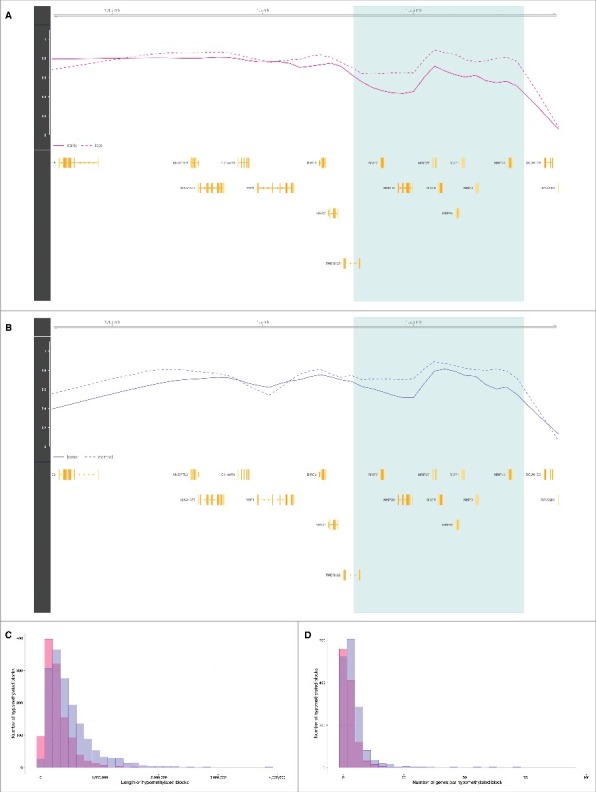
Hypomethylated blocks in placenta and cancer. (A) The light green zone shows an illustrative placenta hypomethylated block representing a difference in average methylation between first trimester (solid line) and third trimester (dashed line) chorionic villi samples. Gene loci are marked in yellow. (B) The light green zone shows an illustrative cancer hypomethylated block representing a difference in average methylation between colon adenocarcinoma tumor (solid line) and corresponding normal tissue (dashed line) samples. Gene loci are marked in yellow. (C) Distributions of the lengths of placenta hypomethylated blocks in pink and cancer hypomethylated blocks (colon adenocarcinoma) in purple. (D) Distributions of the number of genes per placenta hypomethylated blocks in pink, and cancer hypomethylated blocks in purple (colon adenocarcinoma). Abbreviations as in Table 1.