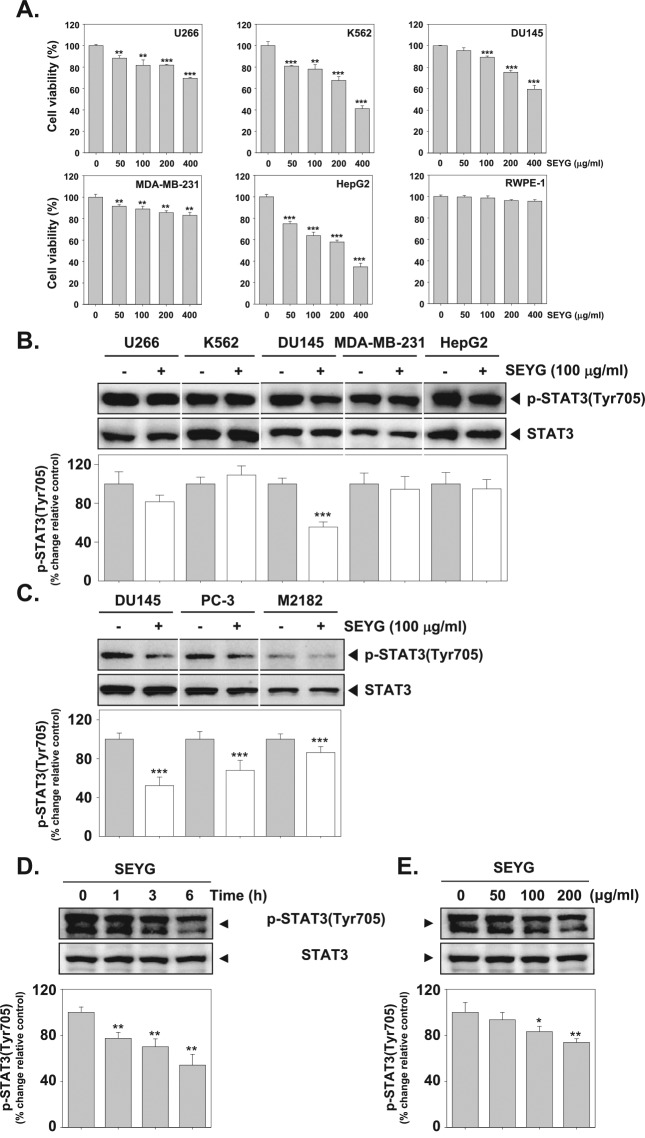
Figure 1.
SEYG suppresses p-STAT3 levels in a time- and dose-dependent manner. (A) U266, K562, DU145, MDA-MB-231, HepG2, and RWPE-1 cells (1 × 10⁴ cells/well) were incubated at 37°C with various indicated concentrations of SEYG for 24 hours, and the viable cells were assayed using the MTT reagent. ***P < .001 compared to nontreated. (B and C) Cells (1 × 10⁶ cells/well) were incubated with the indicated concentrations of SEYG for 6 hours. Whole-cell extracts were prepared, then equal amounts of lysates were analyzed by Western blot analysis using antibodies against p-STAT3 and STAT3. The results shown here are representative of 3 independent experiments. Graphs represent band intensities of indicated proteins. All data were expressed as mean ± SD. ***P < .001 versus control. (D and E) DU145 cells (1 × 10⁶ cells/well) were treated with various indicated concentrations of SEYG and time intervals. Then equal amounts of lysates were analyzed by Western blot analysis using antibodies against p-STAT3 (Tyr705) and STAT3. The results shown here are representative of 3 independent experiments. Graphs represent band intensities of indicated proteins. All data were expressed as mean ± SD. **P < .01 versus control.

