
Figure 3.
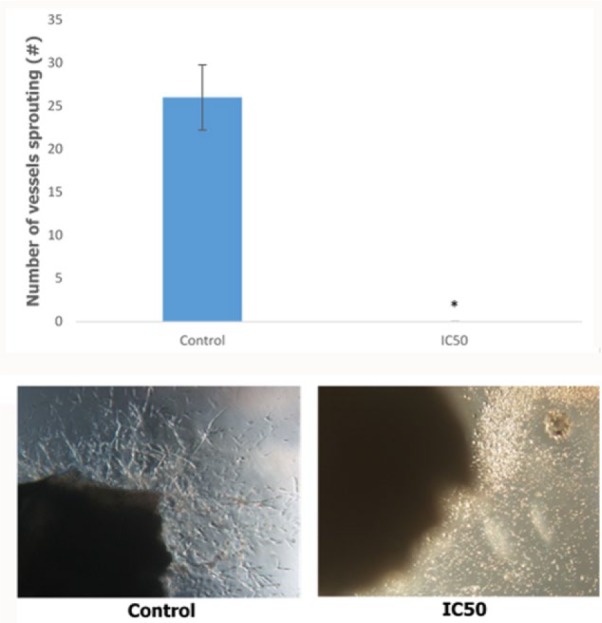
The bar chart analysis and representative image of the ex vivo mouse aortic ring assay. Five different sections of the images were chosen for counting. The vessels protruding from the fragmented aorta were counted. The data are expressed as mean ± standard error of mean and the experiments were done in triplicate. Significance is set at *P < .05. Magnification 10×.