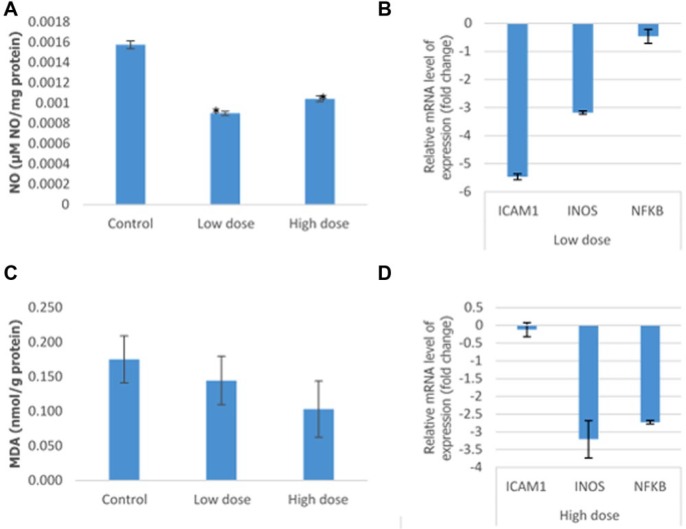
Figure 8.
Analysis of the level of lipid peroxidation and relative level of mRNA in the tumor excised from the control, low-dose (120 mg/kg), and high-dose (240 mg/kg) treated mice. (A) The analysis on the level of nitric oxide (NO) and malondialdehyde (MDA) lipid peroxidation. (B) Analysis of the relative level of the messenger RNA (mRNA) of nuclear factor (NF)-κβ, inducible nitric oxide synthase (iNOS), and intercellular adhesion molecule 1 (ICAM1). The data are expressed as mean ± standard error of the mean. Significance is set at P < .05; n = 5 mice per group.

