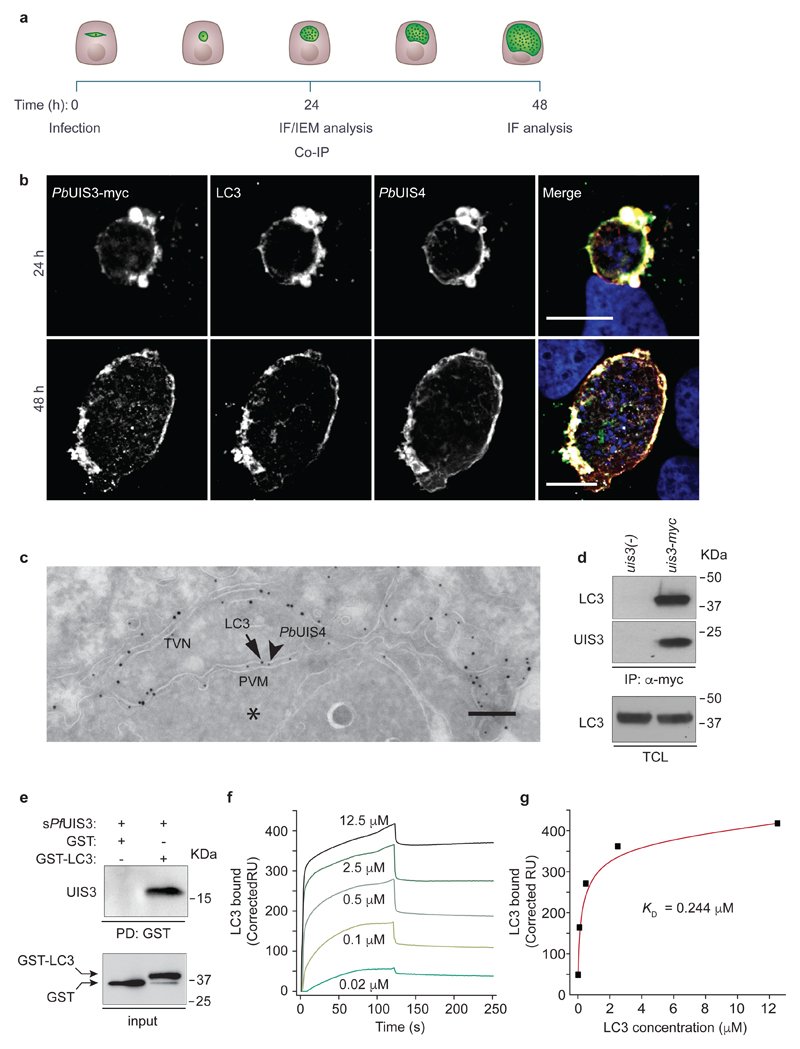
Figure 2. Plasmodium UIS3 binds to host LC3.
a, Timeline of in vitro infection and analysis. b, Representative confocal images (two independent experiments) of Huh7 cells infected with P. berghei expressing UIS3-myc (uis3-myc). Cells were fixed 24 h (top) and 48 h (bottom) after infection and immunostained with anti-myc (white), anti-UIS4 (red), anti-LC3 (green), and Hoescht (blue). Scale bar, 10 μm. c, Representative IEM micrograph of the host-parasite interface in a Huh7 cell 24 h after infection with P. berghei. PbUIS4 and host LC3 are shown labeled with 12 nm (arrowheads) and 18 nm (arrows) gold particles, respectively. The EEF cytosol is marked with an asterisk (*). The PbUIS4-positive structures correspond to the PVM and tubular-vesicular network (TVN) of the parasite. Scale bar, 200 nm. Seventeen randomly selected cells were analysed. d, Lysates of GFP-LC3 HeLa cells infected with uis3-myc or uis3(-) P. berghei were immunoprecipitated with anti-myc. Analysis of the precipitates was done by western-blot with anti-LC3 and anti-myc antibodies (top and middle panels). Total cell lysates (TCL) were immunoblotted with anti-LC3 (bottom panel). e, Purified GST or GST-LC3 were used as bait to pull-down recombinant His-tagged sPfUIS3. Pull-down fractions were immunoblotted with anti-GST and anti-His antibodies. One of four independent experiments is shown (d, e). f, Binding of GST-LC3 to sPfUIS3 immobilised on a sensor chip was analysed by surface plasmon resonance (SPR). The indicated concentrations of GST-LC3 were perfused over the sPfUIS3-coated sensor. Normalized response sensorgrams were calculated by subtracting the unspecific binding contribution of the same molar concentrations of GST alone. g, SPR response units at equilibrium plotted as a function of LC3 concentration. The dissociation constant of the interaction, KD, is shown.

