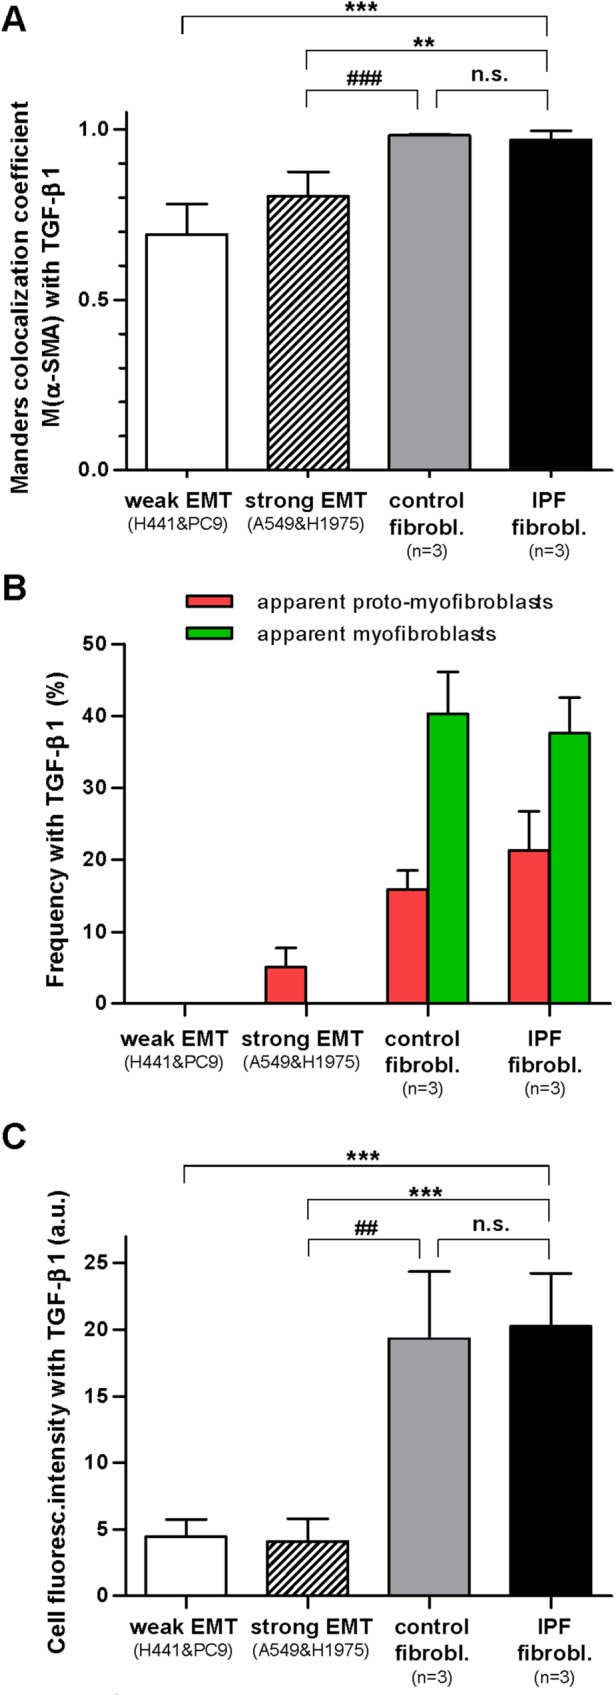
FIGURE 4:

Assembly of α-SMA into stress fibers in EMT-competent lung epithelial cells and primary lung fibroblasts on stimulation with TGF-β1 for 3 d. (A) Quantitative colocalization analysis of the images in Figure 3 through the Manders colocalization coefficient M(α-SMA), which corresponds to the fraction (between 0 and 1) of α-SMA co-occurring with F-actin. (B) Colocalization analysis of the images in Figure 3 in terms of the percentage of cells stimulated with TGF-β1 that exhibited at least three straight and continuous white lines (green bars) or three straight and discontinuous (but not speckled) white lines (red bars), which were interpreted as apparent (well-differentiated) myofibroblasts or proto-myofibroblasts, respectively. (C) Absolute average F-actin fluorescence intensity per cell obtained on stimulation with TGF-β1 in epithelial cells undergoing weak or strong EMT and in primary fibroblasts from either control or IPF patients. Statistical analysis as in Figure 2.
