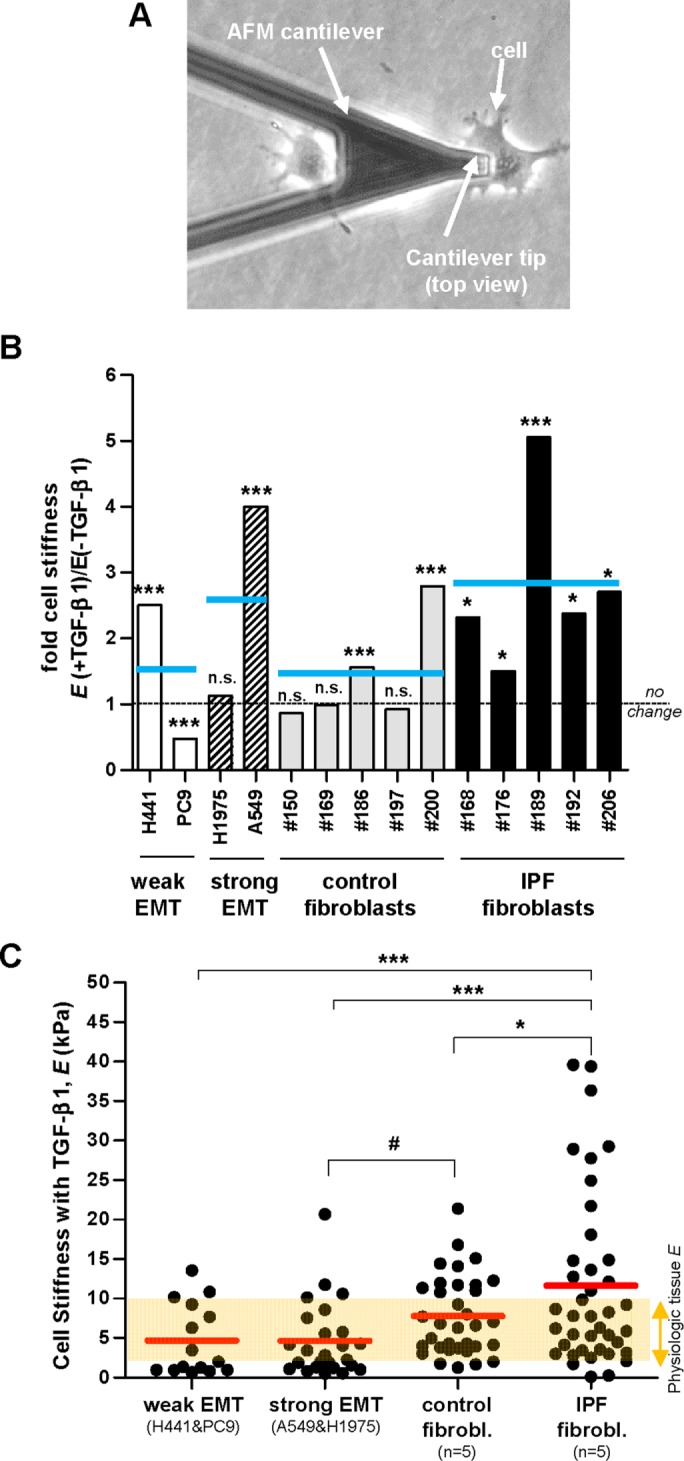
FIGURE 5:

Nanoindentation elasticity measurements of single cells carried out with AFM on lung epithelial cells and primary lung fibroblasts. (A) Representative phase contrast image of an AFM force sensor (cantilever) on top of a single lung epithelial cell (A549). AFM force sensors were used to indent locally the cell surface and assess the corresponding opposing force to compute the Young’s modulus (E) as described in Material and Methods, using three technical replicates. (B) Ratio of the average E values obtained on single cells cultured in the presence or absence of TGF-β1 in a panel of epithelial cell lines (n = 4) and primary fibroblasts from randomly selected control (n = 5) and IPF (n = 5) patients. On average 10 cells were measured per experimental condition (two independent experiments). Horizontal gray dashed line corresponds to no fold change (ratio = 1), whereas horizontal solid blue lines correspond to the average values for each cellular model (i.e., epithelial cells exhibiting weak or strong EMT, and primary fibroblasts from control or IPF patients) as in Figure 1B. The E data for each cell line and patient are shown in Supplemental Figure S5. Statistical analysis as in Figure 1B. (C) E values obtained on single cells on TGF-β1 stimulation from each cellular model. Red horizontal lines correspond to the average E values for each model as in Figure 1C. The semi-transparent orange horizontal band corresponds to the E values assessed on normal pulmonary tissue elsewhere (see the main text for references) and was added to illustrate the aberrant mechanical behavior of IPF fibroblasts. Statistical analysis as in Figure 2.
