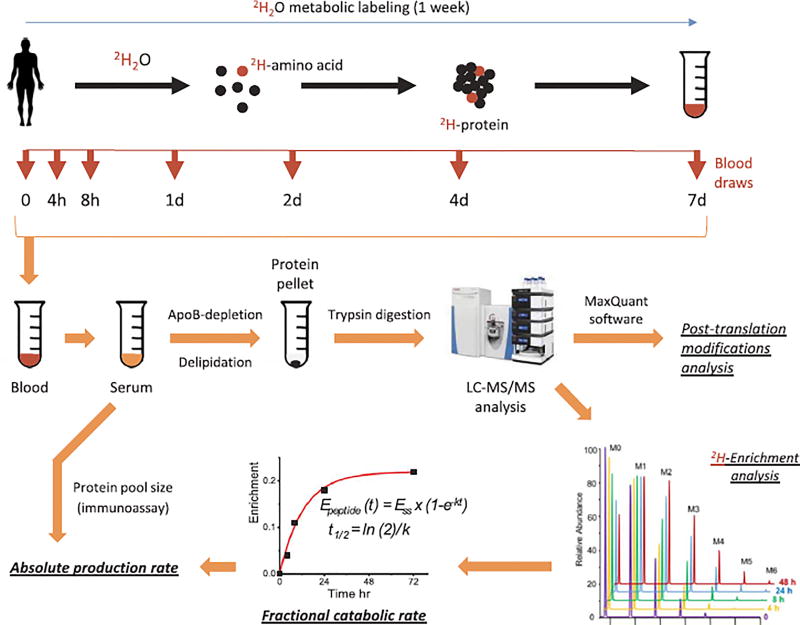
Fig. 1.
Experimental design and the workflow of the study. Control (n = 8) and diabetic (n = 9) subjects received 4.0 ml/kg bolus dose of 2H2O during the first day of the study and 10% of the loading dose/day for the following 6 days. Blood samples were drawn at 0, 4, 8, 24, 48, 96 and 168 h. Serum proteins were isolated and analyzed by LC-MS/MS after depletion of apolipoprotein B-associated lipoproteins, delipidation and trypsin-digestion. High-resolution mass spectra were collected and processed to (i) identify proteins and their post-translational modifications, and (ii) assess protein fractional catabolic rates (k) based on the rate of 2H-incorporation. Production rate of serotransferrin and ceruloplasmin was calculated as the product of protein pool size and their respective fractional catabolic rate.

