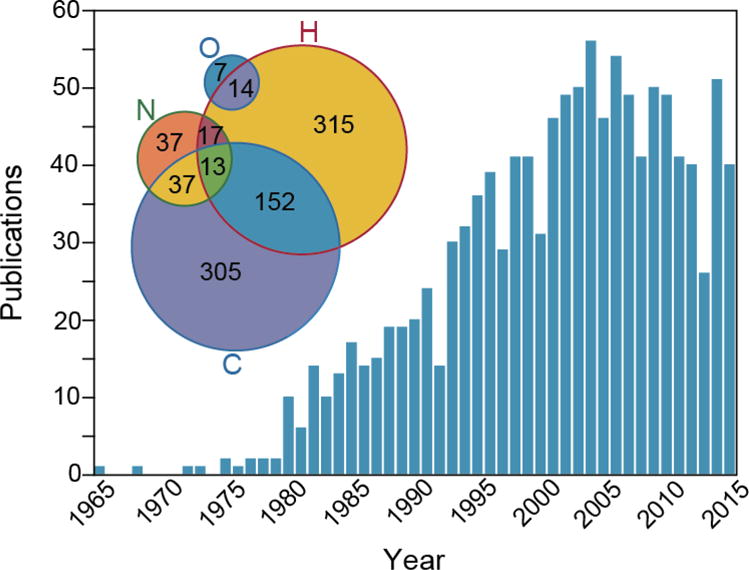
Figure 1. Deuterated metabolic tracers in biomedical research.

Histogram derived from curated list of human studies with “stable isotope” as a search term. The Venn diagram shown in the inset illustrates the relative utilization of different stable isotope labels. The percentages add up to more than 100% due to the fact that some studies utilize more than one stable isotope tracer. Data derived from n = 1178 papers: H = 511 (43.4%), C = 507 (43%), N = 104 (8.8%). **2 studies (C+O and N+O) excluded from Venn diagram for rendering purposes. Less commonly used elements (Fe, Ca, Zn, Se, Cu, Mg, Mo, Cr, Cd, S, Ni; total 256 studies) not shown in Venn diagram for clarity.
