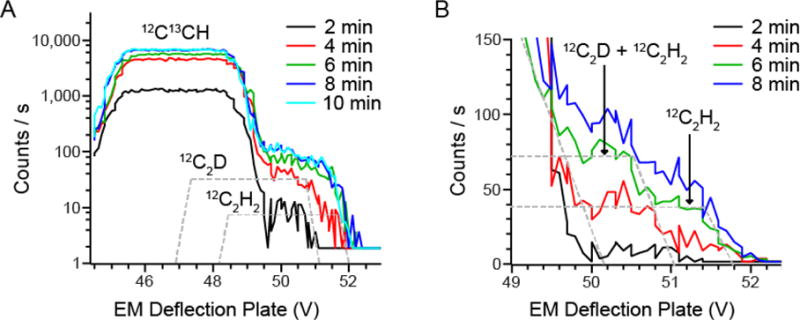
Figure 2. HMR spectra of secondary ions at mass 26 a.m.u from adipose tissue.

The Mass Resolving Power achieved was 14000 with a 10 μm Entrance Slit, 80 μm Aperture Slit and a 40 μm Exit Slit. HMR plots are shown as function of the voltage applied to the electrostatic plates used for scanning the secondary ions beam in front of the Exit Slit. HMR plot were recorded from a scanned 40 × 40 μm field with a 10 pA Cesium beam after 2 min pre-sputtering intervals of a 60 × 60 μm field size with a 750 pA Cesium beam.
(A) HMR plot of the isobars at mass 26. The more distant CN− isobar is shown in Supplemental Figure 2. The voltage step was 0.146 and the counting time 0.54 s per step.
(B) The HMR for each data point are from the average of 3 HMR spectra acquired with a 0.07 V step and a 0.54 s counting time per step.
