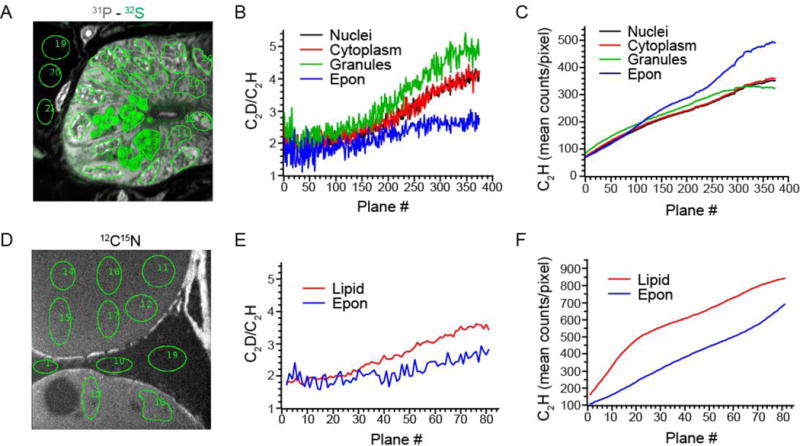
Figure 3. Analytical parameters demonstrating measurement of C2D/C2H as a proxy for D/H.

(A) Unlabeled small intestinal crypt. Pseudocolor merged image of the 32S− (green) and 31P− (gray). Image acquired with a 2.5 pA cesium ion current. Acquisition time was 260 s per plane. 45 μm × 45 μm field size, 256 × 256 pixels. Regions of interest (green outline, ~400 pixels/ROI) from which quantitative data was extracted for graphs in B, C.
(B) Mean C2D/C2H ratio*104 for each ROI category shown in (B) as a function of imaging plane measured with a 10 μm Entrance Slit and an 80 μm Aperture Slit.
(C) C2H ion yield as a function of imaging plane for each ROI category as shown in (B).
(D) Unlabeled adipose tissue. Image acquired with a 7.5 pA cesium ion probe. Acquisition time was196 s/plane. 45 μm × 45 μm field size, 256 × 256 pixels. Regions of interest (green outline) from which quantitative data was extracted for graphs in E, F.
(E) Mean C2D/C2H ratio*104 for each ROI category shown in (D) as a function of imaging plane measured with a 10 μm Entrance Slit and an 80 μm Aperture Slit.
(F) C2H ion yield as a function of imaging plane for each ROI category as shown in (D).
