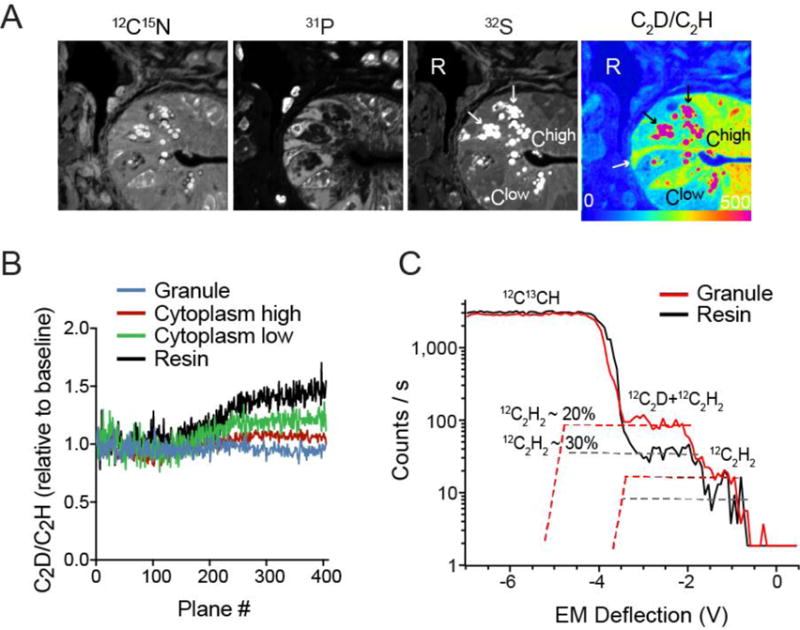
Figure 4. Analytical parameters for measurement of deuterium-labeled samples.

(A) Small intestinal crypt obtained from mouse administered D-water. Cell type specific differences in label incorporation, observable in the ratio image (far right) enhance cells and subcellular structures seen in the single mass images: Black arrows show high labeling in granules which define the Paneth cells at the base of the crypt. The white arrow identifies a representative crypt base columnar (CBC) cell, located between Paneth cells at the base of the crypt, and appear more highly labeled relative to the adjacent Paneth cell cytoplasm. ROIs representing granules (black arrows), resin (R), and regions of high (Chigh) or low (Clow) cytoplasmic labeling were selected for additional analyses shown in B and C.
(B) C2D/C2H ratio normalized to the baseline measurement for each ROI category graphed as a function of imaging plane. Measurements conducted with a 10 μm Entrance Slit and an 80 μm Aperture Slit, and a 40 μm Exit Slit. Data representing the initial window of ratio stability (first 100 planes) and the second higher plateau (planes > 280) are summarized in Table 2.
(C) HMR plot of the isobars at mass 26 not including CN− after completion of extended analysis shown in B. HMR obtained from 10 μm fields containing either resin or granules. An HMR plot of all isobars at mass 26 is shown in supplement figure 2.
