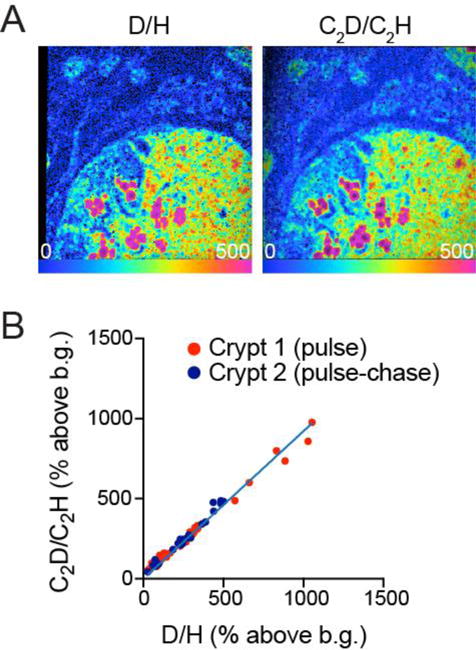
Figure 5. Correlation between C2D versus D measurements in deuterium-labeled tissue.

(A) Small intestinal crypt obtained from mouse administered D-water label. The C2D/C2H ratio image (right) was acquired first. The instrument was then re-tuned and the D/H image (left) was acquired.
(B) ROI were selected to represent subcellular structures as in Figures 3,4. The plot represents the correlation between the C2D/C2H and D/H ratios for the same ROIs, expressed as % above background (resin). Two different fields from two different samples were plotted together demonstrating correlation between the two measurements (slope = 0.93, χ2 = 0.98). The distribution from Crypt 2 is lower because the period of pulse labeling was followed by 3 day label free chase, resulting in downward shift in the labeling distribution.
