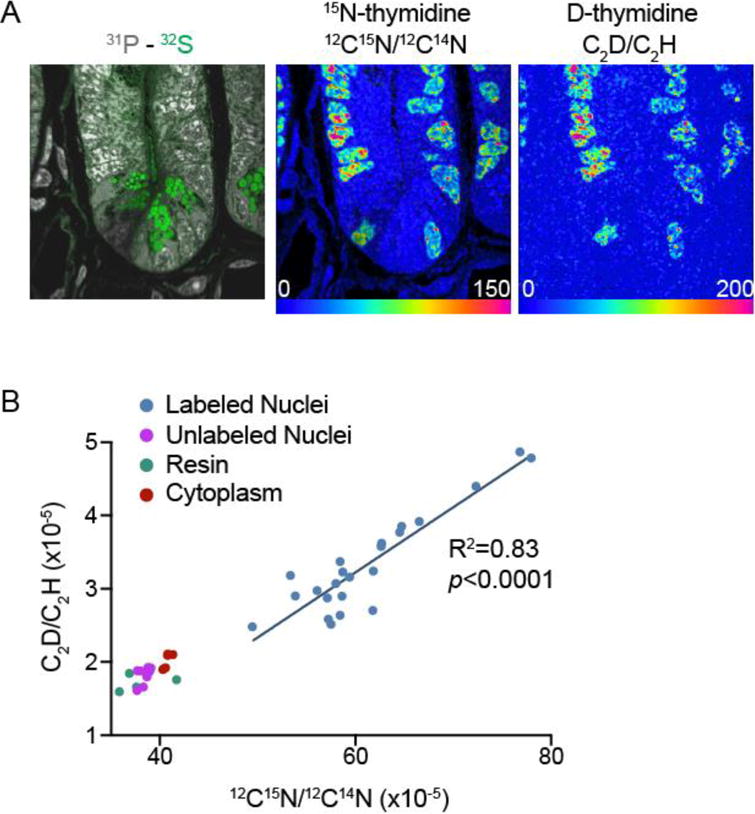
Figure 6. Comparison of D-thymidine measurement to 15N-thymidine “gold standard”.

(A) Small intestine crypt images derived from the sum of 75 planes. 60 μm × 60 μm field size (256 pixels × 256 pixels) obtained with a 3.5 pA cesium beam current. The acquisition dwell time was 3ms/pixel for the series 1 with recording of C2H−, C2D− respectively and 0.5ms/pixel for series 2 which included recording of 12C14N− and 12C15N−. The hue saturation intensity (HSI) scale ranges from blue, set to natural background ratio (expressed as 0% above natural ratio), to red, where the ratio is 150% and 200% above background respectively for 15N and D images.
(B) Linear regression analysis (n = 23 15N-labeled nuclei from A) demonstrates strong correlation between C2D-labeling and 15N-labeling.
